As long as the Japanese stock rally continues defying conventional wisdom of the majority - for instance a bull market in stocks cannot coexist with a bear market in bonds (WRONG!), bearish calls that lack support from even the most basic long-term cycles, the flow of time, will continue.
While Abenonomics, a policy that cannot reverse the effects of a growing global economic contraction, is failing, the majority simply refuses to recognize it. Those that follow the invisible hand do not. The failure of central planning throughout throughout developed economies, the force driving a shift in capital flows from the public to private sector and the periphery to core economies, favors Japanese stocks over Japanese bonds and U.S. dollar-denominated over Yen-denominated assets.
Investors, largely driven by emotions rather than discipline, tend to focus on volatility rather than the message of the market. This tendency prevents them from recognizing better opportunities in quieter markets.
Insights constructs and interprets the message of the market, the flow of sentiment, price, leverage, and time in order to define trends within the cycle of accumulation and distribution for subscribers.
Summary
The BEAR (Price) and BEAR (Leverage) trends under Q2 accumulation after the seasonal high as a focused bear opportunity since the third week of March.
Price
Interactive Chart: Nikkei 225
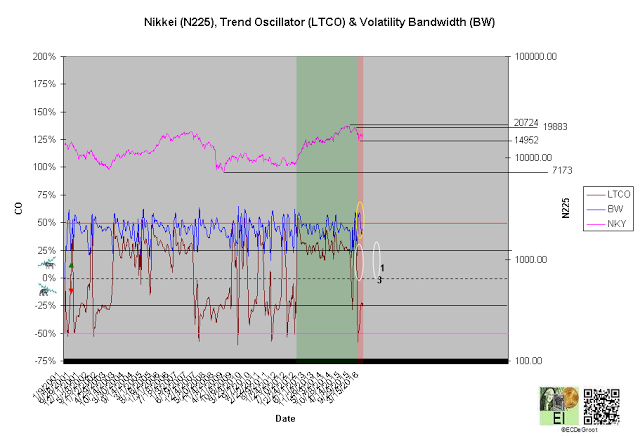
A negative long-term trend oscillator (LTCO) defines a down impulse from 17697 to 17572 since the fifth week of December (chart 1). The bears control the trend until reversed by a bullish crossover. Compression, the final phase of the CEC cycle, generally anticipates this change.
A close above 20724 jumps the creek and transitions the trend from cause to mark up, while a below 7173 breaks the ice and transitions it to mark down.
Chart 1
Leverage
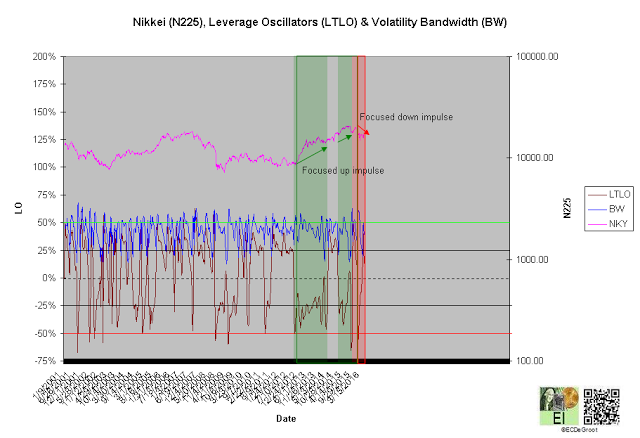
A positive long-term leverage oscillator (LTLO) defines a bear phase since the third week of March (chart 2). This focuses the down impulse (see price).
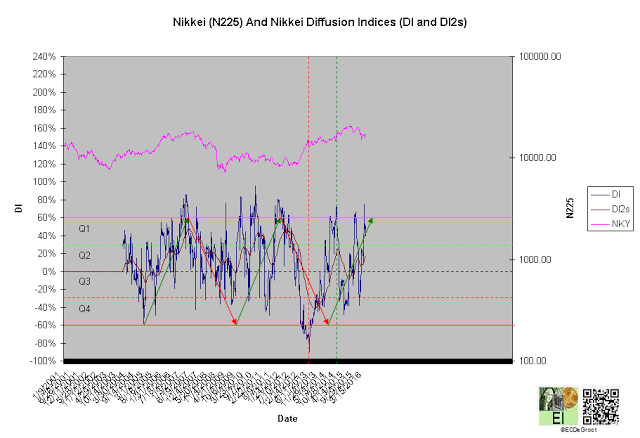
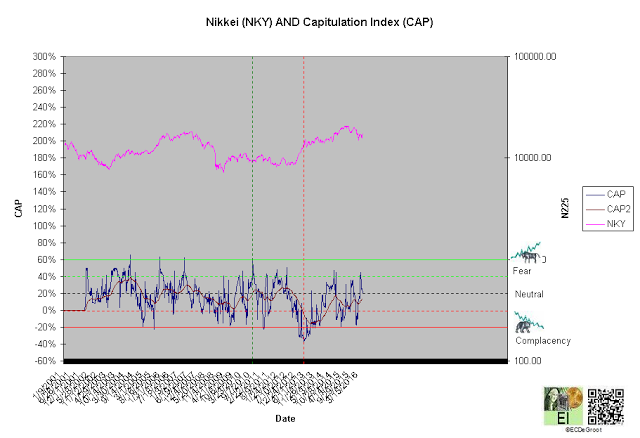
A diffusion index (DI) of 39% defines Q2 accumulation (chart 3). A capitulation index (CAP) of 20% supports this message (chart 4). DI and CAP's trends, broader flows of leverage and sentiment from distribution to accumulation and complacency to fear supporting the bears (green arrows), should not only continue to extreme concentrations but also restrain upside expectations until reversed (see price). A rally under these trends, a sign of strength (SOS), would be bearish for the Nikkei longer-term.
Chart 2
Chart 3
Chart 4
Time/Cycle
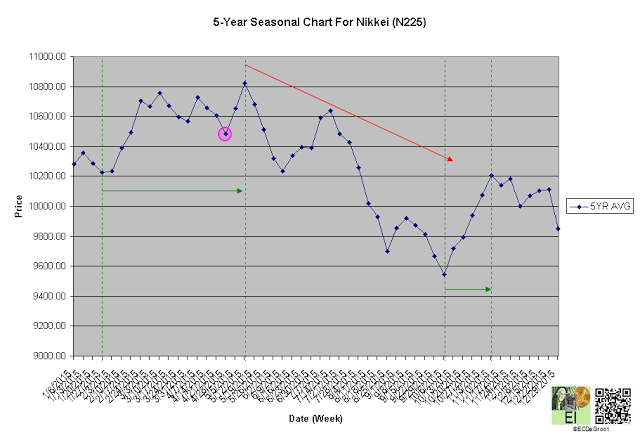
The 5-year seasonal cycle defines strength until the second week of May (chart 5). This path of least resistance restrains downside expectations (see price).
Chart 5

