
With results from almost two-thirds of the S&P 500 index’s total market capitalization already on the books, we have a good sense of how the Q1 earnings season has unfolded. The actual numbers will evolve over the coming days as more companies report results, but the broad pattern emerging from the results thus far will likely carry through to the end.
This broad pattern pertains to broad-based top-line weakness. Not only are revenue growth rates very low, but an unusually large proportion of companies are missing consensus revenue estimates. We knew that growth rates would be challenged this earnings season following the unusually sharp cuts to estimates ahead of the reporting cycle, but the very low revenue beat ratios are nevertheless a standout element of this earnings season.
It appears that the analyst community underestimated the impact of the strong dollar on Q1 results. This point becomes obvious in a comparison of the results thus far between the internationally exposed S&P 500 members and the more domestic oriented Russell 2000 members. More below, but let’s do the numbers first.
Q1 Scorecard (as of April 29th, 2015)
We now have Q1 results from 280 S&P 500 members that combined account for 66.0% of the index’s total market capitalization. Total earnings for these 280 companies are up +9.1% on essentially flat revenues (down -0.1%), with 66.2% beating EPS estimates and only 41.3% coming ahead of top-line expectations. This is weak performance compared to what we have seen from the same group of 280 S&P 500 members in other recent periods.
The two side-by-side charts below give a historical context to the results thus far – by comparing the Q1 earnings and revenue growth rates (left-hand side chart) and earnings and revenue beat ratios (right-hand side chart) with what these same companies achieved in the preceding quarter as well as the 4-quarter average.

Three things stand out as we look at the results thus far
First, the revenue weakness is very notable. We knew that growth will be problematic in Q1, so the weak revenue growth rate of -0.1% compared to other recent periods isn’t that surprising. But the very low proportion of companies beating revenue estimates is surprising and likely indicative that the growth backdrop has been even weaker than what was reflected in consensus estimates.
Second, the earnings growth rate (+9.1%) compares favorably to what we saw from the same group of companies in 2014 Q4 and the 4-quarter average. But the favorable growth rate comparison is solely due to the Finance sector. Exclude Finance from the result and the growth comparison shifts in the other direction, as the right hand-side chart below shows.

The Finance sector has been a big growth contributor this earnings season, with total earnings for the sector up +19.6% on +1.0% higher revenues, with 59.3% of the sector companies beating EPS estimates and 42.6% beating revenue expectations.
The roughly $3.6 billion year over year positive swing in Bank of America's (NYSE:BAC) total earnings is a big contributor to the sector’s strong growth numbers. But it will be unfair to credit Bank of America for all of Finance’s growth thus far. Others like J.P. Morgan (NYSE:JPM), Goldman Sachs (NYSE:GS) and Citigroup (NYSE:C) showed genuine earnings growth on the back of improved capital markets businesses even though the interest rate backdrop continues to be challenging. The regional banks have been unable to show the same growth momentum that we saw from the bulge-bracket firms.
Total earnings for the biggest sector in the S&P 500, the Technology sector, are up +7.5% on +8.1% higher revenues, with only 47.2% of the sector companies beating EPS and revenue estimates. Please keep in mind that the sector’s respectable-looking growth numbers are solely due to Apple's (NASDAQ:AAPL) strong quarterly report. Exclude Apple from the Tech sector and the Q1 earnings growth rate for the sector drops to a decline of -2.4% (from +7.5%). For the S&P 500, earnings growth will drop to +7.6% if Apple is excluded from the results already out.
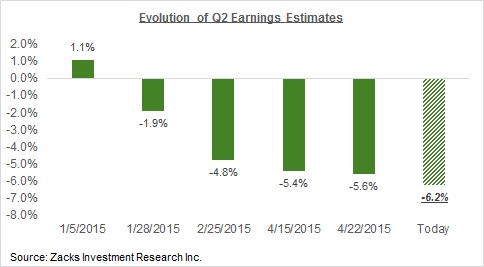
Third, as has been the norm in recent quarters, management teams continue to guide lower for the current and following quarters. As a result, estimates for the current quarter, which had fallen quite a bit already in solidarity with the Q1 estimate cuts, have started coming down even more. The chart below shows how earnings growth estimates for Q2 have evolved since the beginning of the year.
The dollar issue has added to the Energy sector’s woes and some concerns about the U.S. economic picture in bringing down this year’s estimates. Current consensus estimates show earnings growth for the S&P 500 to be in the negative for the first three quarters of the year, with the growth rate for the full-year now modestly in the negative. The expectation is that the growth picture starts improving in the last quarter of the year, with the growth pace ramping up to double-digit rates in 2016.
The Russell 2000 Scorecard
As of yesterday, we now have Q1 results from 540 Russell 2000 members that combined account for 31% of the small-cap index’s total market
capitalization. Total earnings for these Russell members are up +22.3% from the same period last year on +7.7% higher revenues, with 54.3% beating earnings estimates and 39.4% beating revenue estimates. Here is the current scorecard for the 540 Russell 2000 companies that have reported results already:

We are not quite as far along in the reporting cycle for the small-caps as we are for the large caps. But the growth rates and beat ratios for the Russell 2000 companies are broadly in-line with, or modestly better than, what we have been seeing in other recent periods. This is in contrast to what we have been seeing from the S&P 500 companies, as discussed above.

The most notable takeaway from the Russell 2000 comparison chart above is the revenue beat ratio. The chart below focuses solely on the beat ratio by doing a side-by-side comparison of beat ratios for the two indexes.

Revenue surprises for the Russell 2000 companies are tracking a tad bit below levels in other recent periods, but nowhere near levels that we are seeing for the S&P 500 companies. The most plausible explanation for this divergence seems to be the greater exposure to currency issues for the large-cap companies. After all, the S&P 500 companies earn roughly 40% of their earnings from beyond the U.S. shores. The
Russell 2000 companies aren’t entirely domestic based either, but the magnitude of their international exposure is a lot smaller.