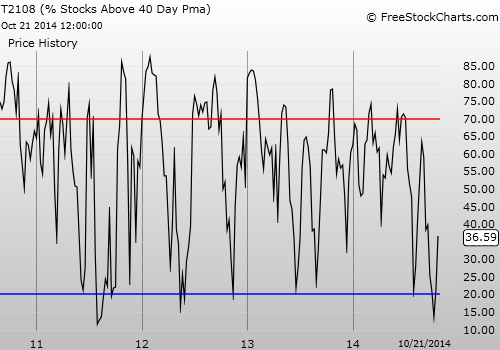
T2108 Status: 36.6% (a 34% increase!)
T2107 Status: 42.9%
VIX Status: 16.1 (now 50% down from the recent peak!)
General (Short-term) Trading Call: Shorts should have minimal positions; hold long positions and/or buy on dips.
Active T2108 periods: Day #3 over 20%, Day #1 over 30% (ending 20 days under 30%), Day #27 under 40%, Day #29 under 50%, Day #31 under 60%, Day #73 under 70%
Commentary
In the last T2108 Update, I wrote the technical case for a bottom. In the two trading days since, the bulls and buyers have delivered bigtime.
T2108 closed at 36.6% with its third sharp run-up in the last 4 days. It was last at this level on September 22nd. This ends a 20-day 30% underperiod. The S&P 500 (SPDR S&P 500 (ARCA:SPY)) lost 2.1% over this time span, right along expectations for a 30% underperiod that lasts so long. The period ended “just in time” as the S&P 500’s expected performance declines almost linearly for every extra day!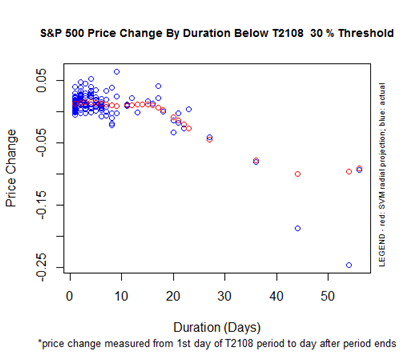
S&P 500 Price Change By Duration Below the T2108 30% Threshold
T2107, the percentage of stocks trading above their 200DMAs, has jumped back to 42.9%. Its repair is not as impressive relative to T2108: T2107 was last at its current level on October 1st. This level also served as resistance for the next 6 trading days. In other words, there are still plenty of stocks to buy for betting on resumptions of up-trends.
The S&P 500 (SPY) is now firmly above its 200DMA in a very bullish recovery from the last oversold period. The move through this critical trendline was nearly picture perfect. The index closed just below the 200DMA on Monday, gapped up to open Tuesday, and soared relentlessly from there – leaving shorts crying bloody murder and buyers rushing to catch the train. It is hard to get a more convincing revenge of the bulls and buyers than THIS kind of move!
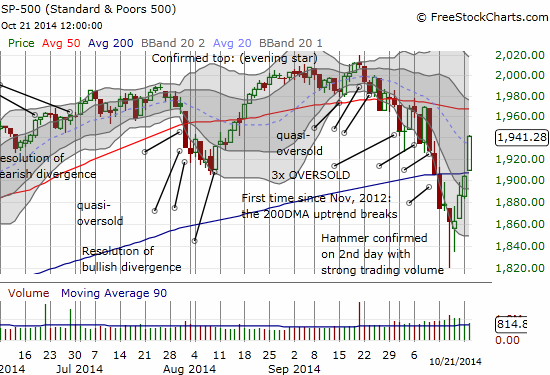
The S&P 500 makes a resounding return to bullish territory with a 2.0% gain
The S&P 500 has reclaimed the August low and now all eyes will be on the 50DMA as resistance. From there it is the all-time high which was carved with an evening star topping pattern.
The NASDAQ is asking the S&P 500 what took so long as its 2.4% rally confirms a breakout that happened the day before.
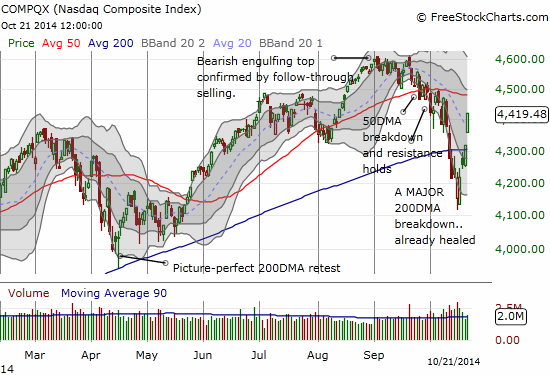
The NASDAQ confirms its breakout above its 200DMA
The sharp rally has crushed volatility. The VIX has amazingly already fallen 50% off its peak which now sits conveniently just above the 2012 high. I daresay the double failure to hold those highs was a bright red warning flag to bears to stand down and a bright green flag for buyers to bet on a bounce from oversold conditions. I covered the first warning in the T2108 Update at that time titled “Buyers FINALLY Draw A Line in the Sand.” The plunge in the VIX of course crushed ProShares Ultra VIX Short-Term Futures (ARCA:UVXY). I also warned earlier that the momentum in UVXY had likely ended.
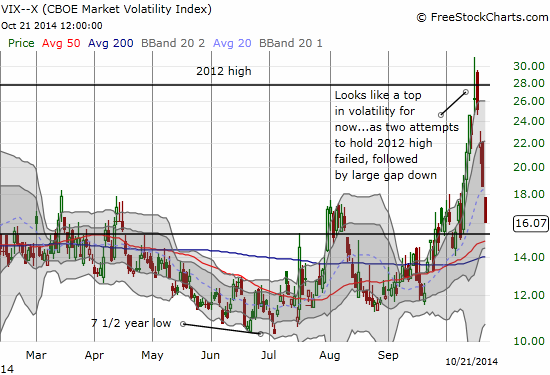
Volatility has been crushed and now hovers just above the 15.35 pivot point
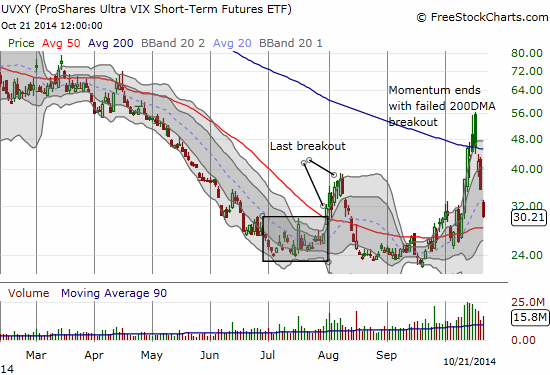
The failure of UVXY to hold the 200DMA breakout two days in a row was the last bright red warning flag for bears to stand down
The trading call follows the rules I outlined earlier. Bears should have already covered most of their positions during the oversold period and/or upon the 200DMA breakout of the NASDAQ and/or the S&P 500. This is a very dangerous period for bears because the inclination is to cling to the palpable fear and the visual of the rush for the exits that we just witnessed last week. However the rapidly improving technical outlook suggests those dark days are already becoming a distant memory and a patch of bearish nostalgia. That is, a NEW and FRESH negative must emerge on the horizon to get the sell-off to resume. Bears may still have some fun trying to fade on 50DMA resistance. Without overbought conditions at that point, I think 50DMA resistance will melt away. Bears will have to move quickly again.
Conservative traders just got their buy signal. They can stop out if the indices manage to close below the 200DMA again. Otherwise, it is back to riding the trend.
Aggressive traders are OK to take some hard-earned profits from making the bold, yet rule-based, buys during the oversold period. Consider it a reward for courage well-done. I myself sold my UVXY puts..wishing I had bought a whole lot more! I am holding my ProShares Ultra S&P500 (ARCA:SSO) shares for what I hope will be the entire duration of what I traditionally a strong season for stocks (November to April).
Daily T2108 vs the S&P 500
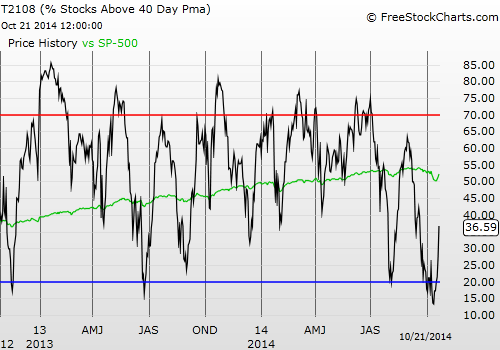
Black line: T2108 (measured on the right); Green line: S&P 500 (for comparative purposes)
Red line: T2108 Overbought (70%); Blue line: T2108 Oversold (20%)
Weekly T2108
Disclosure: long SSO shares

