A Little “Did You Know” From JP Morgan:
On average the market experiences a -14.2% intra-year decline, but the market has still ended the year positive in 27 of the last 35 years. The point is that volatility is quite normal, and if anything we’ve become a bit spoiled by the lack of it over the last few years.
Wesbury on Durable Goods:
A surprisingly strong report on new orders of durable goods shows the economy continues to plow on with no signs of weakening. Orders for durable goods rose 2% in July, exceeding even the highest estimate of all 76 economists who were surveyed, and were revised higher for previous months. A big chunk of the gain in July came from the very volatile transportation sector, specifically a 4% increase in autos, which brought the overall transportation sector up 4.7% for the month. The good news was that orders excluding transportation still rose 0.6%. Some pessimists may point out that orders are down 19.6% from a year ago, but this is due to a statistical anomaly. In July of last year, transportation orders soared as Boeing (NYSE:BA) took in a massive order for 324 new planes. Excluding the volatile transportation sector, orders are still down 2.5% from a year ago.
But this too doesn’t tell the whole story, as the decline is due almost entirely to the precipitous drop in energy prices since mid-2014. We believe these factors are temporary, and in the last three months orders excluding transportation are up at a 5% annual rate.
The best news in the report was that “core” shipments, which exclude defense and aircraft, increased 0.6% in July and were up 1.3% including revisions to prior months. Plugging these and other recent data into our models, we are forecasting real GDP grew at a 3.3% annual rate in Q2 and will be up at a 2.0% annual rate in Q
“Davidson” Submits:
The wide spread belief that one must ever be on one’s toes to jump at a second’s notice in or out of the markets because economies can reverse then reverse again on proverbial ‘dimes’ has been at work the past several weeks. To the many who hold this view, I send my apologies ahead of time. The perspective provided here is at the very least an outlier, but it may even further from consensus than that. This is a call for inaction, no panic, no trading or adjusting positions. Simply ‘nada!’ Do nothing! Be patient!
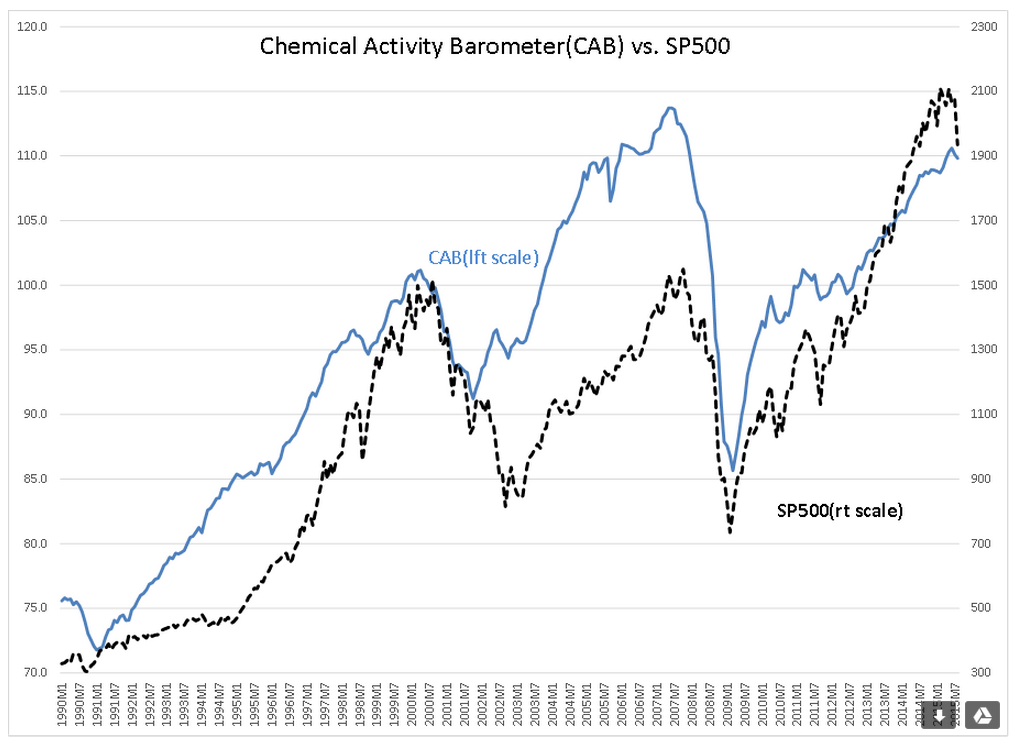
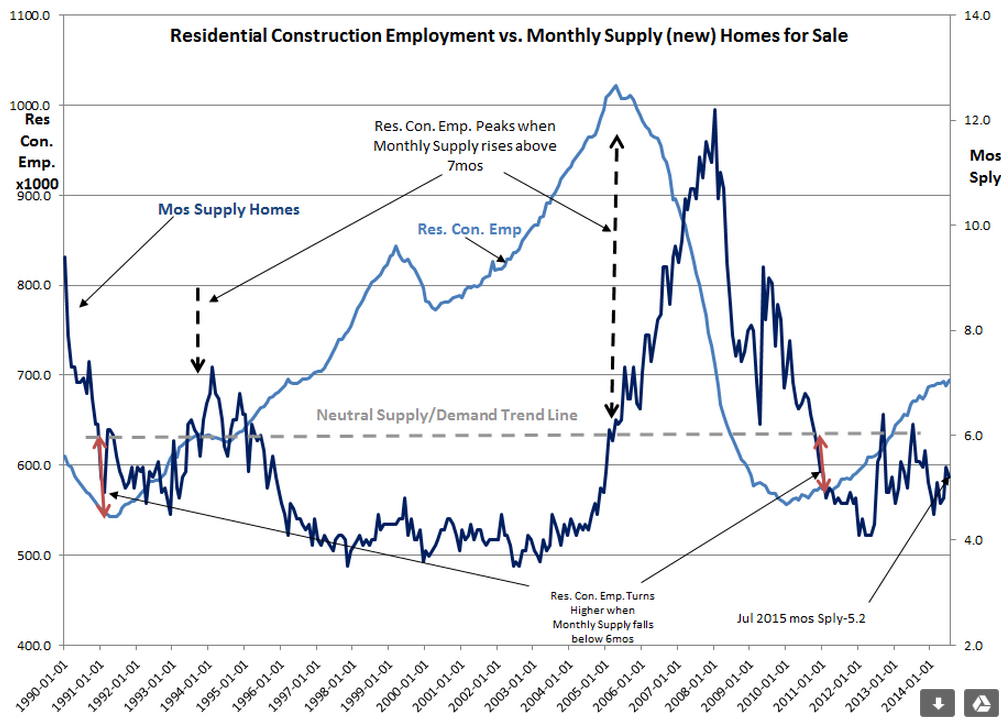
The monthly Chemical Activity Barometer (CAB) and Monthly Supply of New Homes for Sale came out this morning. The charts are below. First, the Monthly Supply of New Homes for Sale fell from 5.4 months to 5.2 months. This means less home inventory and reflects a continuation of Demand/Supply reflecting more Demand than Supply. This is good news! The current level of Demand causes rises in Residential Construction Employment levels which was revised higher several thousand in the past 3 months. This slow and steady improvement is occurring in spite of continued tight mortgage lending. The MCAI (Mortgage Credit Availability Index) while it rose to 125.5 in July remains well below the 300 range of 2004 which represented a reasonable level before government sub-prime craziness drove it to 800. Economic activity generally trends slowly on the upside and can only be measured through stringing together several months of data to smooth out the natural choppiness exhibited due to statistical data collection methods. Economic data during corrections does fall more rapidly than in uptrends, but no proverbial ‘turning on a dime’ ever occurs. There has always been a 12mo-24mo transition period in which slowing was evident and provided investors ample time to adjust portfolios if they are paying attention. ‘Black Swans’ occur to those who were not paying attention.
Secondly, the past 4 months of CAB has been revised higher. What appears to be a slight decline in the July level includes higher revisions by 0.1% to 0.5% the previous 4mos. Some may be tempted to ignore the revisions and point to the decline from July as significant, but this would be ignoring the fact that revisions occur in this series just like any economic series. The uptrend has in fact continued.
For the market (SPDR S&P 500 (NYSE:SPY)), the past 2 days have already been very busy. For economics, the uptrend simply continues. The ‘call to action’ is do nothing, remain calm, be patient, the end is not at hand.
Disclaimer: The information in this blog post represents my own opinions and does not contain a recommendation for any particular security or investment. I or my affiliates may hold positions or other interests in securities mentioned in the Blog, please see my Disclaimer page for my full disclaimer.

