According to Bloomberg data, the modest year-to-date increase in the S&P 500 is attributable to health care and retail alone. Worse yet, the two industry segments trade at a 20% premium to the market at large. Paying a premium for growth is one thing. Chasing a handful of momentum stocks is another.
Brokerage firm Jones Trading sharpened the knife even further, noting that six corporations account for more than the entirety of the meager 2015 gains in the S&P 500. Those companies? Amazon (NASDAQ:AMZN), Apple (NASDAQ:AAPL), Facebook (NASDAQ:FB), Gilead Sciences (NASDAQ:GILD), Google (NASDAQ:GOOGL) and Walt Disney Company (NYSE:DIS). The narrowing of the market itself coupled with the types of businesses on the list (with the possible exception of Walt Disney) strongly resembles late 1990s euphoria.
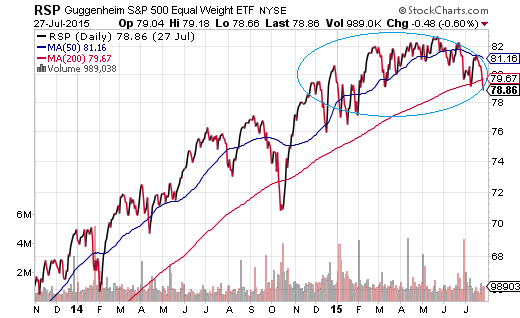
What happens when one examines the S&P 500 on an equal-weighted basis? We find that that stocks have been stuck in one of the tightest trading ranges in market history for as long as the Federal Reserve ended quantitative easing (“QE3″). Here is the performance of the Guggenheim Equal Weight S&P 500 ETF (NYSE:RSP) since QE3 wrapped up at the end of October in 2014.
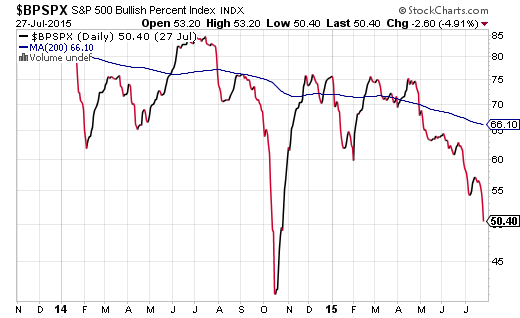
The ongoing deterioration in the S&P 500’s Bullish Percentage Index (BPI) underscores the challenges that investors face. Do they chase the Googles and the Gileads? Do they look for value in the energy patch through acquiring beaten down exchange-traded proxies like SPDR Sector Select Energy (ARCA:XLE)? Or do they recognize that 50% of the S&P 500 components are currently in downtrends – a demarcation that is unfavorable for the long-term sustainability of the 3rd longest bull in history.
Clearly, there is a dichotomy between the health of the overall stock market and the relatively high price of the popular benchmarks. Addressing the internal components of major benchmarks like the S&P 500, Dow Jones Industrials, NYSE Composite or NASDAQ as they relate to the handful of momentum leaders in those benchmarks leaves one to ponder what will happen next. Will the weight of the overall market crush the Atlas-like performance of health and retail? On the flip side, is it possible that underachieving sectors like industrials, materials, energy, utilities, transports and telecom might join the winner’s circle?
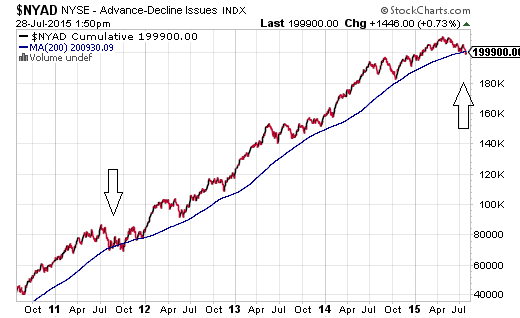
Unfortunately, history suggests that overvalued sectors tend to crumble and join the beleaguered areas, as opposed to the troubled spots catching a bid first. Indeed, the last time that the New York Stock Exchange’s Advance Decline Line (A/D) Line fell below a 200-day moving average, the broader S&P 500 fell more than 19%. It occurred in July of 2011 as the euro-zone crisis had been spiraling out of control.
For those that believe the illusion of economic acceleration could help the cause, media spin and double seasonally adjusted GDP reporting will not help. The reality of a lusterless U.S. economy is far too great. The manufacturing, mining, and utilities that collectively comprise the industrial sector recently registered its weakest year-over-year growth in a half-decade. Wholesale sales have dropped steadily over the past four years. Exporting on a strong dollar has been difficult for those multi-nationals that operate in Asia and Europe. Wage growth has been stuck in and around 2% since the end of the Great Recession in 2009. The workforce participation rate – a measure of actual employment – is as poor as it had been in the recession-weary late 70s. And home ownership at 63.4% is the lowest that it has been since 1967.
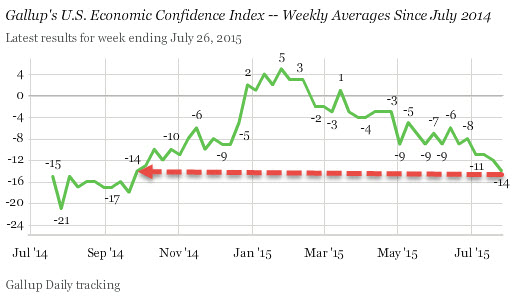
What about the consumer? Aren’t people feeling wealthier? I suppose this depends upon the people you ask. The Conference Board’s US Consumer Confidence was about as discouraging a data point as anyone has seen lately. Consumer expectations plummeted from 92.8 to 79.9 – the lowest reading since February 2014. And Gallup’s reading last week wasn’t much better; that is, for whatever reason, Americans believe the economy is getting worse.
As long as the Federal Reserve maintains its plan to raise the cost of borrowing, and as long as the U.S. dollar rises alongside those expectations, the broader market is likely to remain range-bound. You’d have to hold the horses that have been winning, like iShares S&P 100 (NYSE:OEF) and SPDR Select Health Care (ARCA:XLV). Yet you wouldn’t necessarily want to add to your overall equity position.
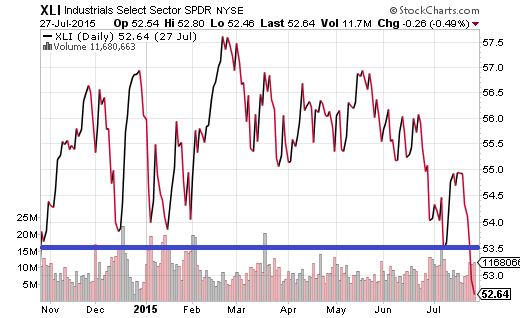
You might also want to avoid areas of the market that are weakening in the face of higher borrowing costs and a higher greenback. Industrials via Sector Select Industrials (ARCA:XLI) have gone nowhere in the nine months since QE3 officially ended.
Disclosure: Gary Gordon, MS, CFP is the president of Pacific Park Financial, Inc., a Registered Investment Adviser with the SEC. Gary Gordon, Pacific Park Financial, Inc, and/or its clients may hold positions in the ETFs, mutual funds, and/or any investment asset mentioned above. The commentary does not constitute individualized investment advice. The opinions offered herein are not personalized recommendations to buy, sell or hold securities. At times, issuers of exchange-traded products compensate Pacific Park Financial, Inc. or its subsidiaries for advertising at the ETF Expert web site. ETF Expert content is created independently of any advertising relationships.

