
The futures markets have voted: Did Donald Trump awaken the bull market in stocks?
It is no surprise the markets are fickle. Wall Street appeared to favor the stability of a Clinton regime but in the end, they voted for growth policy following a Donald Trump victory. Whether or not the stock market's optimism will be mimicked in the economy is yet to be known, but for now we believe the euphoria could take us into year's end.
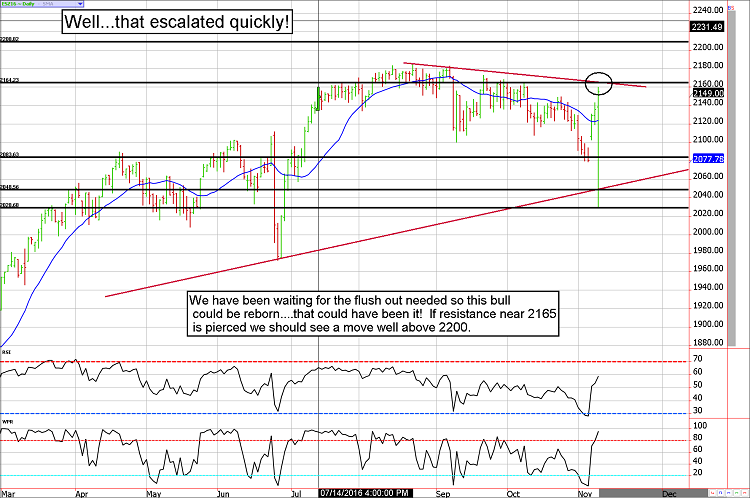
Stocks often find a significant low in October, this year it seems that low might have been a few weeks late. Nevertheless, seasonal strength and one of the most convincing key reversals we've ever seen has us looking higher. That said, volatile markets can change quickly. The bulls will need to break above 2165, until this occurs the bears are still alive.
Now that the election is over, the market "should" start focusing on the Fed.

Treasuries experienced historic volatility on election night
As this newsletter was being written, the 30-year Treasury bond had fallen 8 points off the overnight high. This type of volatility is rare; in my twelve (+) years as a futures broker I've only witnessed such a move on a handful of occasions.
Normally I would be looking at such a massive discount in pricing as an opportunity for the Treasury bulls; particularly in an environment such as this in which the seasonal pressures are bullish. However, given the complete breakdown in the chart and the overwhelming probability of margin calls in this particular market, we will reserve our opinion until we see what things look like when the dust settles.
With that said, the 10-year note is within a point of substantial weekly support and the 30-year bond is within about 2 points. There could be a good buying opportunity around the corner.
Treasury Futures Market Analysis
**Bond Futures Market Consensus:** Our idea of long call options was good, but traders would have had to have been nimble to take advantage. Let's see what the next day or two looks like before making any bold predictions.
**Technical Support:** ZB : 156'20 and 154'13 ZN: 127'26 and 126'12
**Technical Resistance:** ZB: 161'19, 163'11, and 166'11 ZN: 129'03, 129'28, and 130'29
Shock and awe in the ES
Election night volatility did not disappoint. Last night's trading session probably made some trader's dreams come true and turned into a nightmare for others. As advertised, the S&P sold off sharply on a Trump victory but to the surprise of many it rebounded even more on the prospects of economic growth.
Our put spreads performed relatively well but massive volatility worked against fill quality on the way out (last night) and our inclination to play it safe also cut into profits, but we don't regret it. Going into last night we had a FREE trade with no risk (thanks to fortunate timing as we legged in) so any profit was "gravy".
Throughout the years I've learned that more trading tragedies come from event risk than profits, so despite leaving money on the table we are happy with the way things turned out.
We do think the markets have turned the corner, but chasing them higher is a fools game. Let's see what it does with 2165.
Stock Index Futures Market Ideas
**e-mini S&P Futures Market Consensus:**
That looks like a key reversal to us. Look for a break of 2165 to propel the bulls.
**Technical Support:** 2083, 2048, and 2028
**Technical Resistance:** 2165, 2184, and 2209
e-mini S&P Futures Day Trading Ideas
**These are counter-trend entry ideas, the more distant the level the more reliable but the less likely to get filled**
*High volatility equates to wide pivot areas.*
ES Day Trade Sell Levels: 2175, 2189, and 2209
ES Day Trade Buy Levels: 2104, 2078, and 2023
In other commodity futures and options markets....
June 23 - Go long corn futures near 392 using mini contracts (the beginning of a scale trade). Full-sized contracts can be used if available margin and risk tolerance is appropriate.
June 30 - Buy September mini (or full-sized) wheat near $4.47.
July 5 - Add to the long mini corn (or full sized) near $3.45.
July 14 - Sell the corn add-on near 370 to lock in a profit (hold the original entry).
July 29 - Buy mini corn future near $3.33 to average entry cost lower.
July 29 - Buy mini wheat to add to our long and adjust the average position entry to $4.25ish.
August 18 - Sell half of the mini wheat position to lock in a profit of about 20 cents on the add-on contract. We'll hold the original position in hopes of a continued upswing.
August 29 - Sell December live cattle 99 put for about 140 (or $560).
September 30 - Sell the December Fed funds futures contract near 99.52.
October 6 - Buy March Euro strangles using the 123 calls and the 100 puts for about $400. This trade is looking for a sharp increase in volatility.
October 19 - Buy back December cattle 99 put, sell 2 92 puts and 1 106 call to replace it. this slows the trade down and spreads risk away from the current market price.
October 24 - Buy December ES 1950 puts for about 7.00 ($350).
October 27 - Liquidate half of the corn position, which was added near $3.33 to lock in a profit of about 20 cents.
October 27 - Buy December 10-year note 130.50 call for about $220.
November 1 - Sell December 1860 puts for 7.00 to convert our long 1950 put into a FREE bear put spread.
November 3 - Sell the December 130.50 ZN call to lock in a moderate gain (roughly $187.50 per contract before transaction costs).
November 8 - Exit ES put spreads. This recommendation was made in the overnight session in high volatility. Fill quality and timing of exit varied, but most traders made a profit of $500 to $600 per contract before transaction costs.
DISCLAIMER: **There is substantial risk of loss in trading futures and options.** These recommendations are a solicitation for entering into derivatives transactions. All known news and events have already been factored into the price of the underlying derivatives discussed. From time to time persons affiliated with Zaner, or its associated companies, may have positions in recommended and other derivatives. Past performance is not indicative of future results. The information and data in this report were obtained from sources considered reliable. Their accuracy or completeness is not guaranteed. Any decision to purchase or sell as a result of the opinions expressed in this report will be the full responsibility of the person authorizing such transaction. Seasonal tendencies are a composite of some of the more consistent commodity futures seasonals that have occurred over the past 15 or more years. There are usually underlying, fundamental circumstances that occur annually that tend to cause the futures markets to react in a similar directional manner during a certain calendar year. While seasonal trends may potentially impact supply and demand in certain commodities, seasonal aspects of supply and demand have been factored into futures & options market pricing. Even if a seasonal tendency occurs in the future, it may not result in a profitable transaction as fees and the timing of the entry and liquidation may impact on the results. No representation is being made that any account has in the past, or will in the future, achieve profits using these recommendations. No representation is being made that price patterns will recur in the future.