It's Not That Simple
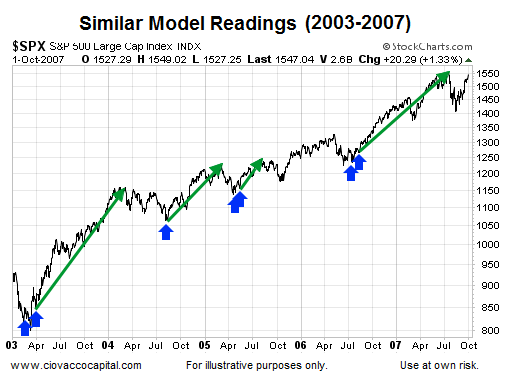
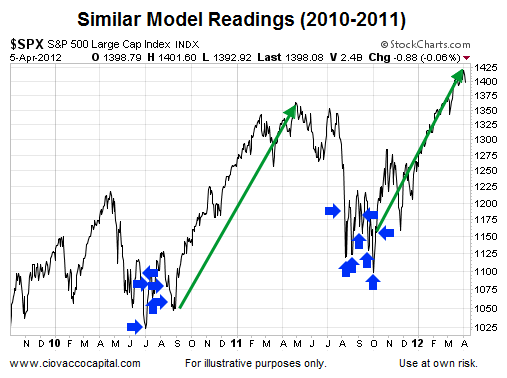
Before you look at the charts below and say, “hey, this is easy…now's the time to buy”, keep in mind that the two charts below show similar CCM Market Model readings within the context of a bull market. The same model readings were present numerous times between October 2007 and March 2009 (a bear market). Nothing says 2015 cannot flip into a bear market, which means we have to remain open to all outcomes (good and bad).
If The Evidence Improves…
The blue arrows show similar CCM Market Model readings (2003-2007) to what we have seen in the past few days. During a bull market with more conviction than the current bull market, low model readings were followed by impressive gains in stocks, telling us to keep an open mind about bullish outcomes in 2015.

This Chart Is Probably More Like 2015
The last few years of the current bull market have been fueled by record-low interest rates and have featured somewhat tepid conviction and confidence in central planners. Notice in 2010 and 2011 during “crisis periods”, bottoms tended to be a multi-month process rather than the sharp reversals between 2003 and 2007.

Compare and contrast how long markets remained in a weak technical state in the two bull markets; compare the number of blue arrows before a rally was successful. The recent clustering of blue arrows speaks to waning confidence in the economy and central planners (investors are more skeptical). The higher degree of skepticism may also result in a much harsher bear market the next time around. People may be willing to run for exits much faster in 2015 than they were in October 2007. The million dollar question is “when could that process begin”. It may have already started; it may not start for several years.
How Can This Help Us?
We are currently in a bull market until proven otherwise, meaning the bull market analysis remains relevant for now. The present day readings of the CCM Market Model simply tells us to be ready to redeploy cash if/when the hard evidence begins to improve. There is no need to guess or anticipate. If a sustainable rally occurs, the evidence will improve. If a sustainable rally does not occur, the improvement in the evidence will be muted/contained.
The difference between the bull markets (2003-2007/2009-2014) and the low readings found in early 2008 is the hard evidence began to improve significantly during the bull markets, which was not the case in 2008. Therefore, as always, the hard evidence, price, charts and model will continue to guide us. If we see enough improvement, we will take action. If we do not, we will remain patient.
