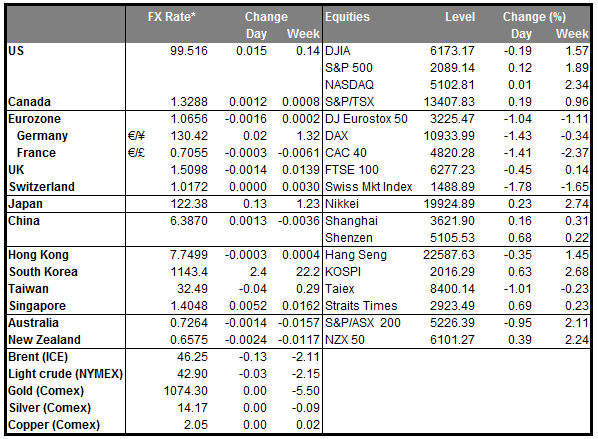
• RBNZ signals it won’t focus on low headline inflation RBNZ Governor Wheeler dampened expectations for further rate cuts overnight as he stated that it would be inappropriate for the Bank to cut rates in order to offset the temporary effects of low oil prices. The Governor repeated that the official cash rate tends to influence inflation over an 18-24 month period, implying that the effects of the previous cuts may not be apparent yet. Bank officials may feel even less pressure to act also after the unemployment rate declined significantly in Q4, beating expectations of a minor increase. However, if concerns around the global economy deepen, which could impact New Zealand’s economy, officials may need to ease again to ensure the rise of inflation. The kiwi strengthened on both the Governor’s comments and the fall in the unemployment rate, and could gain further on any signs that the global turbulence is stabilizing.
• BoJ Kuroda mimics Draghi… BoJ Governor Kuroda stated there is no limit to the measures for monetary easing and signaled the Bank’s readiness to cut rates again. He countered criticism that the Bank is running out of policy ammunition and said that if the current measures are not enough, officials could institute new tools to meet their inflation target. While the Governor did not offer many clues on what could be the trigger of further easing, he did state that global volatility and slowing EM economies could discourage firms from boosting wages. Such external risks could hurt Japanese business sentiment, which may delay inflation from reaching the target.
• Today’s highlights: During the European day, we get the final service-sector PMIs for January from the countries we got the manufacturing data on Monday. The final forecasts for France, Germany and Eurozone are the same as the initial estimates, so no major reaction is expected.
• The UK service-sector PMI for January is forecast to have fallen somewhat from the previous month. Bearing in mind the mixed results of the manufacturing and construction PMIs for the same month, the services index could provide more evidence on how the economy has started the year. Services account for the vast majority of the UK’s GDP and therefore, a possible decline in the services PMI could confirm that the UK economy had a soft entrance in 2016.
• Eurozone’s retail sales for December, a closely watched measure of household confidence, are forecast to have rebounded on a monthly basis after falling for the previous three months. The expected rise in the figure could mainly be due to seasonal factors such as holiday shopping. However, an improving labor market and lower energy prices may also be reflected in a possible improvement in sales. This could support the common currency a bit, at least at the release. Norway’s AKU unemployment rate for November is due to be released as well.
• From the US, we get the ADP employment report for January, two days ahead of the NFP release. The ADP report is expected to show that the private sector gained 195k jobs, fewer than it did in the previous month where the print hit 257k. Nevertheless, this is still pretty close to the 200k mark and also in line with the Fed’s view from the latest statement that labor market indicators will continue to strengthen. Although an unreliable predictor of the NFP number, this could increase the likelihood that the NFP print on Friday may also come near 200k. Expectations for the NFP figure are currently at 190k. The ISM non-manufacturing PMI and the final Markit service-sector PMI, both for January, are also coming out. There is no forecast available for the Markit index but in any case, the market generally pays more attention to the ISM figure which is expected to have fallen. Given that the ISM manufacturing index for January remained below its 50 line for the 3rd consecutive month, a decline in the non-manufacturing index could cause the dollar to lose some steam.
The Market
EUR/USD oscillates around 1.0925
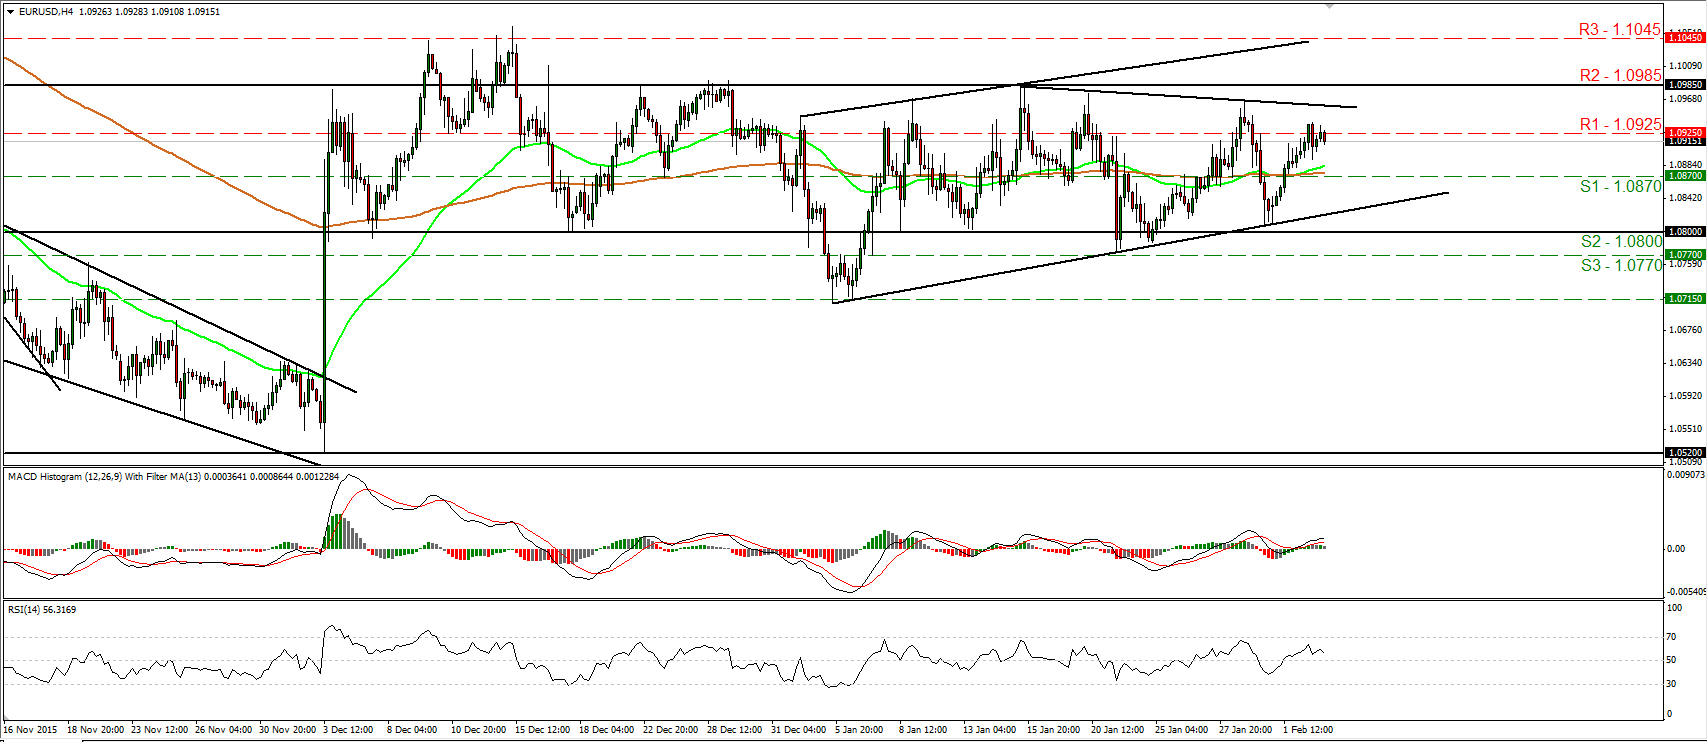
• EUR/USD traded in a consolidative manner on Tuesday, oscillating around the 1.0925 (R1) resistance hurdle. Having in mind the inability of the bulls to drive the battle higher from that point and taking a look at our short-term oscillators, I would now expect the next wave to be negative. The RSI has turned down and could fall back below its 50 line soon, while the MACD, although positive, shows signs of topping. Today, we get the ADP employment report for January. If the report gives evidence that the US labor market continues to improve, it could encourage the bears to pull the trigger. Nevertheless, although we may see the pair pulling back for a while, given that it still oscillates between the 1.0800 (S2) zone and the resistance of 1.0985 (R2), I still consider the near-term trend to be to the sideways. As for the bigger picture, I will hold the view that as long as the pair is trading above the support obstacle of 1.0800 (S2), the longer-term picture stays flat as well.
• Support: 1.0870 (S1), 1.0800 (S2), 1.0770 (S3)
• Resistance: 1.0925 (R1), 1.0985 (R2), 1.1045 (R3)
EUR/GBP stays within a sideways range
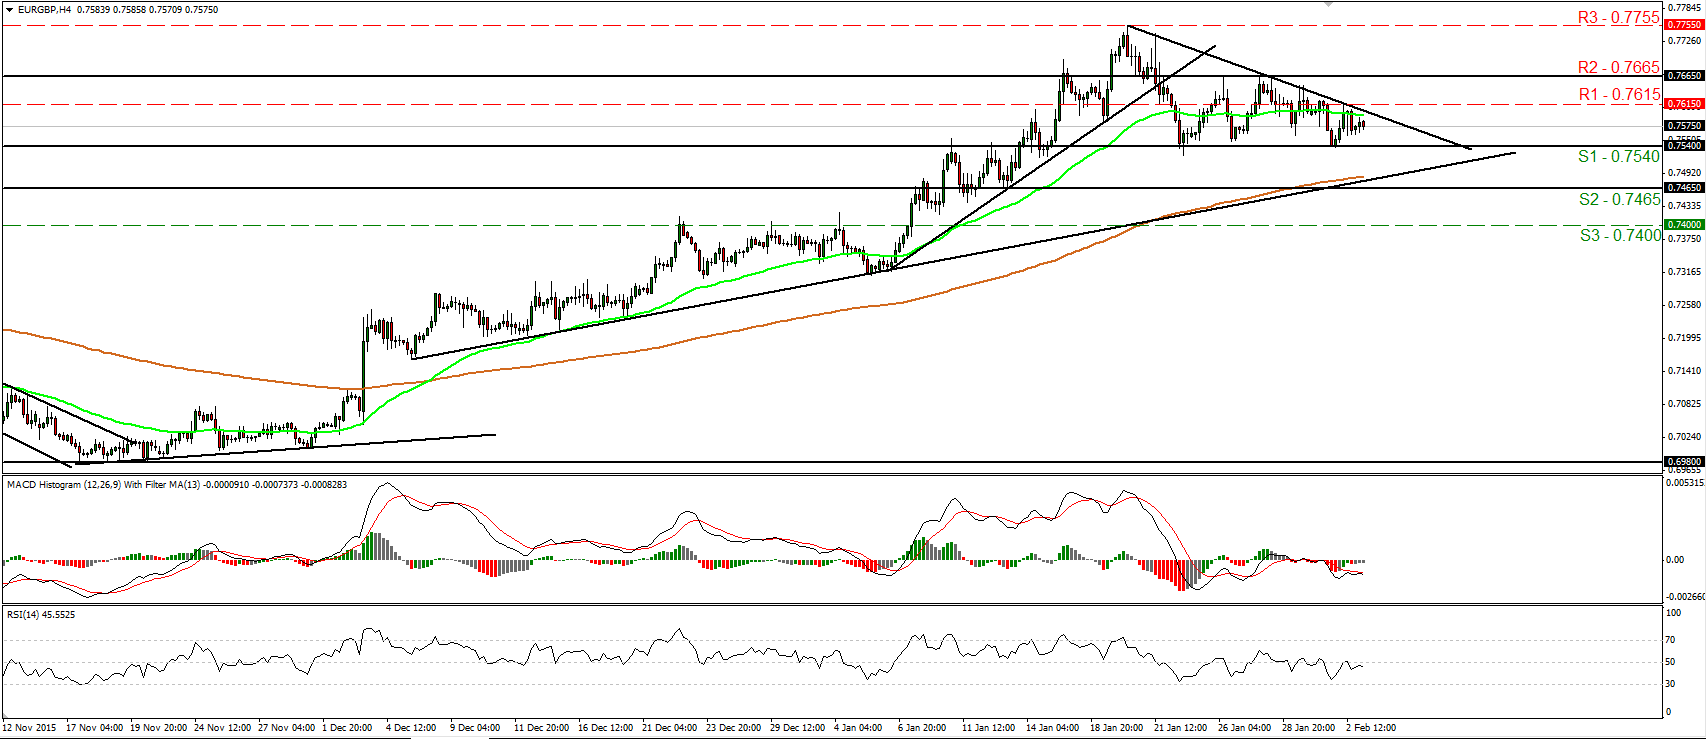
• EUR/GBP continued trading quietly on Tuesday, staying between the support zone of 0.7540 (S1) and the resistance territory of 0.7665 (R2). The pair has been oscillating between these two zones since the 21st of January. As a result, I still consider the short-term outlook to be flat. A clear move above 0.7665 (R2) is needed to turn the picture to the upside, something that could open the way for another test at the 0.7755 (R3) resistance hurdle, defined by the peak of the 20th of January. On the other hand, a dip below 0.7540 (S1) is possible to challenge the upside support line drawn from the low of the 7th of December or the 0.7465 (S2) support line. Switching to the daily chart, I see that on the 8th of January, the rate managed to emerge above the upper bound of the sideways range the pair had been trading since the beginning of February 2015. This has turned the medium-term outlook positive and as a result, I would treat any possible short-term downside extensions as a corrective phase for now.
• Support: 0.7540 (S1), 0.7465 (S2), 0.7400 (S3)
• Resistance: 0.7615 (R1), 0.7665 (R2), 0.7755 (R3)
USD/JPY falls back below 120.00
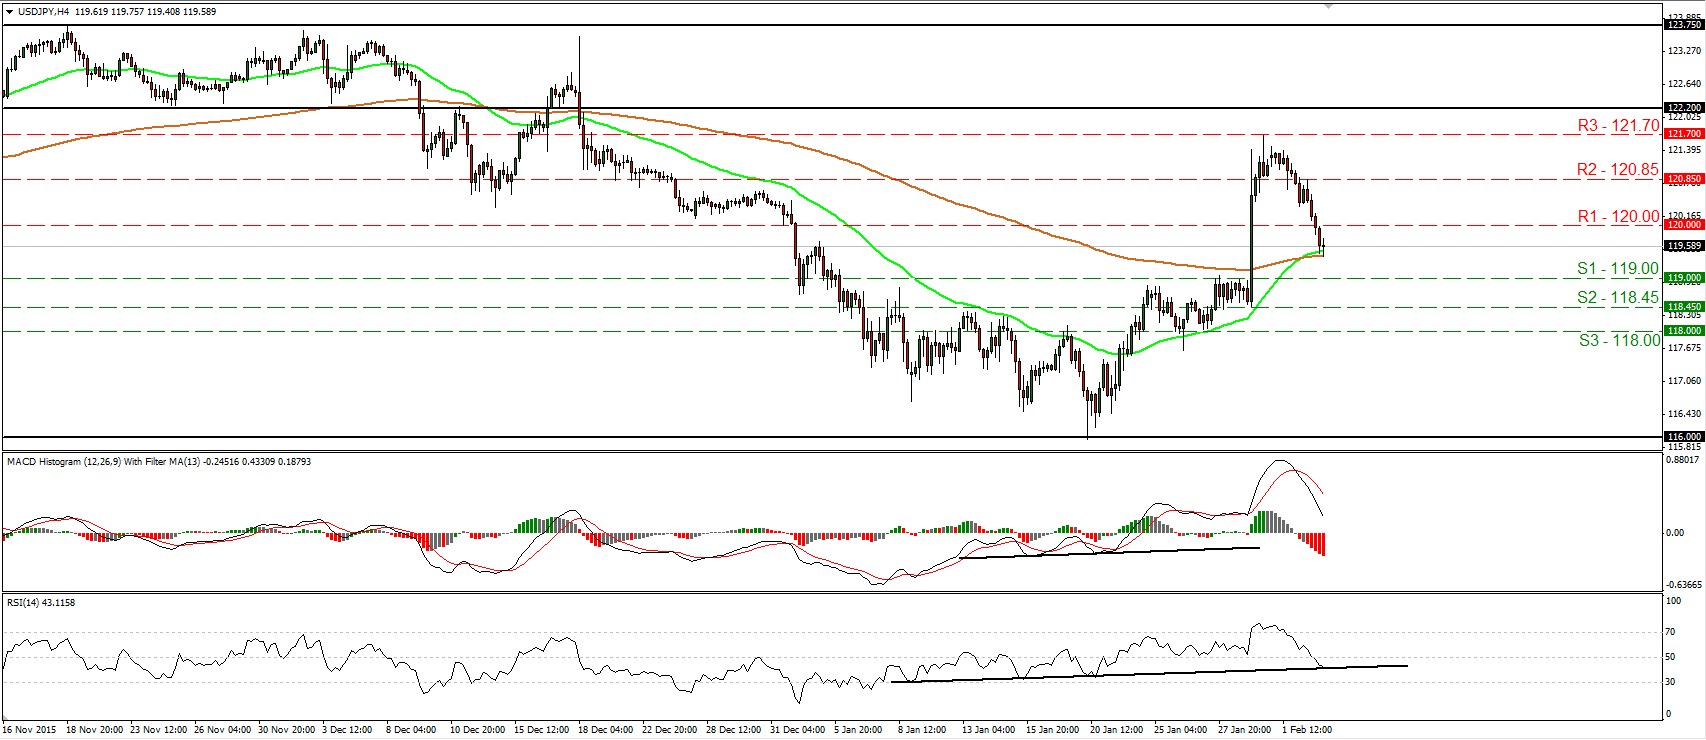
• USD/JPY traded lower yesterday, falling back below the psychological zone of 120.00 (R1). The pair gave back most of the gains it made following the decision of the BoJ to cut interest rates into the negative territory. The bears now look to be headed for a test at 119.00 (S1) and if they are strong enough to overcome that barrier, I would expect them to aim for our next support of 118.45 (S2). Our short-term oscillators reveal downside speed and corroborate that view. The RSI fell below its 50 line and now looks able to move below its upside support line, while the MACD, although positive, stands below its trigger line and is headed towards zero. As for the bigger picture, with no clear evidence of a trending mode on the daily chart, I prefer to maintain my “wait and see” stance as far as the medium-term picture is concerned.
• Support: 119.00 (S1), 118.45 (S2), 118.00 (S3)
• Resistance: 120.00 (R1), 120.85 (R2), 121.70 (R3)
Gold hits resistance fractionally below 1132
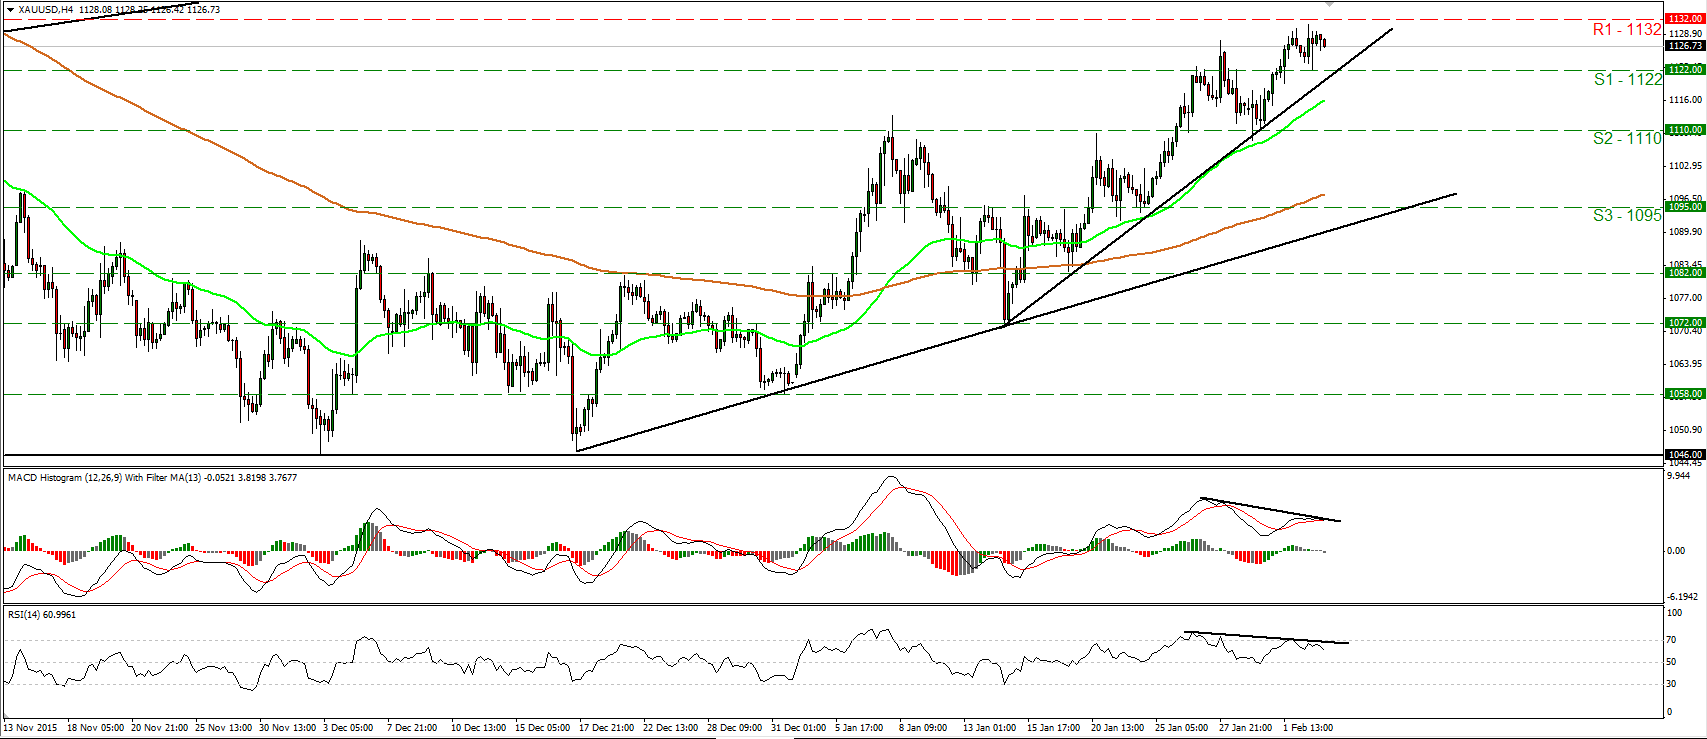
• Gold traded somewhat higher after it found support at the 1122 (S1) line. However, the advance hit resistance one dollar below the 1132 (R1) obstacle and then the metal retreated. The price structure remains higher peaks and higher troughs since the 14th of January and as a result, this keeps the near-term outlook positive. A clear break above 1132 (R1) is possible to open the way for the next resistance at 1140 (R2). Nonetheless, shifting my attention to our short-term momentum studies, I see the likelihood for further retreat, perhaps for another test at 1122 (S1). The RSI slid after it hit resistance at its 70 line, while the MACD, has topped and just fallen below its trigger line. There is also negative divergence between both the indicators and the price action. A break below 1122 (S1) is the move that could shift the short-term bias somewhat negative and could open the way for the next support of 1110 (S2). As for the broader trend, the break above 1110 (S2) on the 26th of January has confirmed a forthcoming higher high on the daily chart, something that keeps the medium-term outlook somewhat positive.
• Support: 1122 (S1), 1110 (S2), 1095 (S3)
• Resistance: 1132 (R1), 1140 (R2), 1150 (R3)
WTI slides below the 30.00 mark
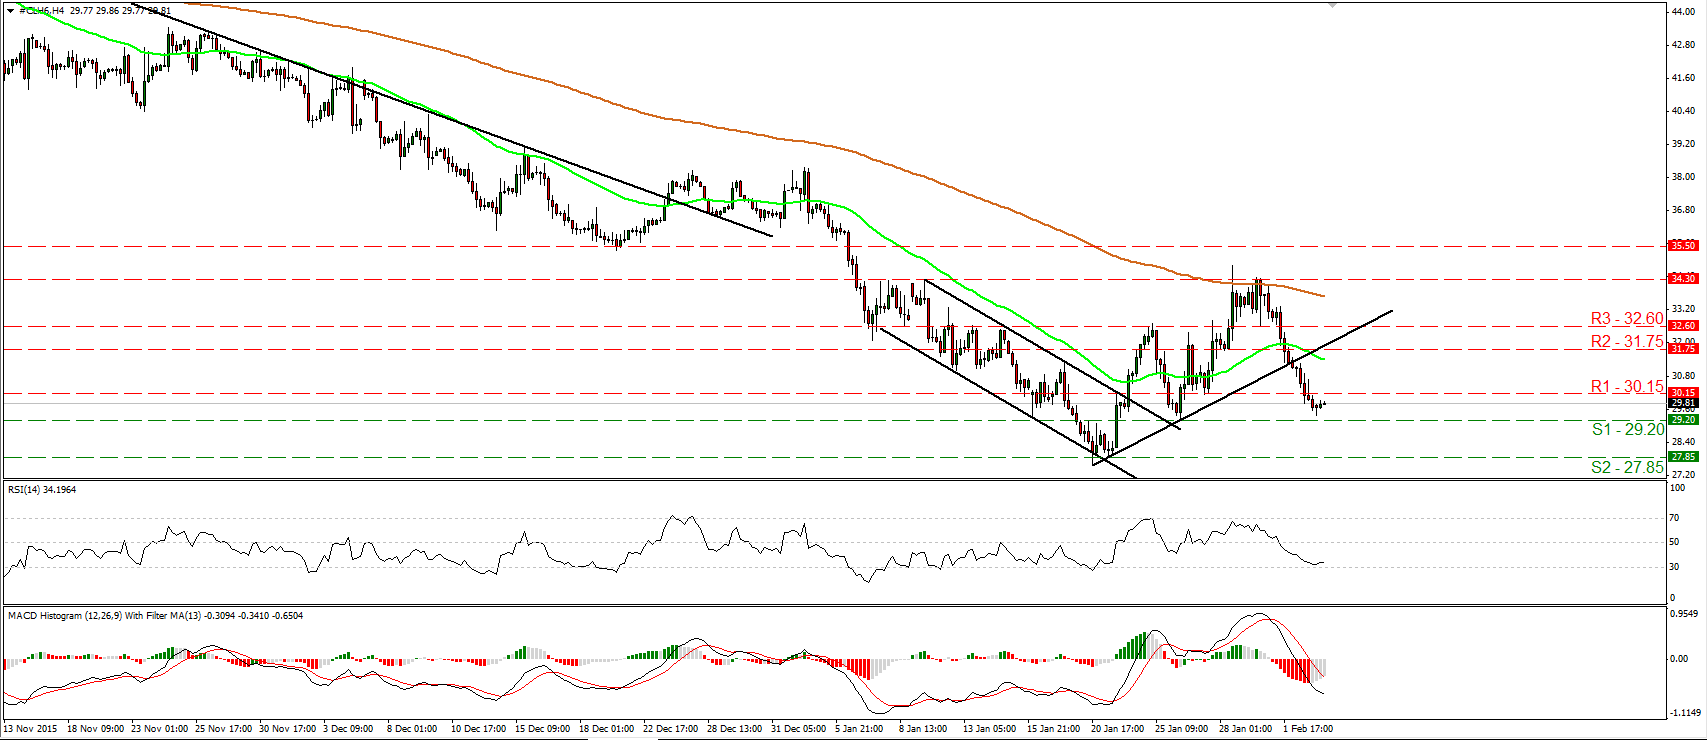
• WTI traded lower on Tuesday, falling below the support (now turned into resistance) line of 30.15 (R1). Given that the price is now trading below the upside support line taken from the low of the 20th of January, I would consider that the short-term outlook has turned back negative. A decisive break below 29.20 (S1) is possible to carry more bearish extensions and perhaps aim for another test at 27.85 (S2), defined by the low of the 20th of January. Taking a look at our short-term oscillators though, I see the possibility for a minor bounce before sellers seize control again. The RSI rebounded from near its 30 line, while the MACD, although negative, shows signs of bottoming. On the daily chart, I see that WTI has been printing lower peaks and lower troughs since the 9th of October. What is more, the decline started on the 29th of January, has confirmed that the recovery from 27.85 (S2) was just a corrective phase. As a result, I would consider the longer-term picture of WTI to stay negative.
• Support: 29.20 (S1), 27.85 (S2), 25.00 (S3)
• Resistance: 30.15 (R1), 31.75 (R2), 32.60 (R3)


