Forex News and Events
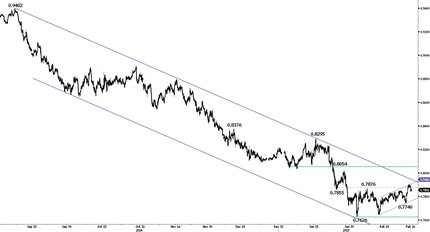
The influence of accommodating monetary policy continues to dominate financial markets. Today the evidence is clearly witness in Australian. Accommodating policy drives currency lower while pushing equity markets higher (regardless if central bankers call it a currency war, competitive devaluation or QE policy). Overnight the AUDUSD sold-off to 0.7840 slowing its recent bullish advanced. The stock market was slightly softer, as S&P/ASX reached a seven years high at 5955.50. The key driver was the collapse of Australia’s private capital expenditure. CAPEX for Q4 2014 declined -2.2%Y against expected -1.6%Y fall. This is the critical first read of capital expenditures for 2015-2016 since its sets the tone for the rest of the year. The estimates came in at AUD109.8 billion against the market consensus for AUD119 billion. A sizeable deceleration in spending expectation. As expected the biggest hit was the mining sector yet there were cuts in non-mining sectors recovery, dimming forward outlook, and suggesting broad-based economic weakness. The rates market were quick to react sending expectations for a RBA OCR cut to 52% from 38%. Given the FOMC slightly dovish turn, the RBA now has more room to cut without any geopolitical backlash (accusations of targeting FX). We now expect the RBA to cut 25bp at next week’s rate decision meeting as signs of slowing growth has increased. As a results we anticipate further weakness in AUD. AUD/USD recent recovery nearing 0.7942 downtrend provide opportunity to reload short positions (see Daily Technical Report). That said, with China expected to accommodate further with RRR cuts, rate cuts and financial reforms in the medium term these will be bullish development for Australia growth outlook.
USD and global yields are shifting lower based on the view that Fed Chair Yellen’s testimony indicates a more dovish Fed. We suspect that Yellen is more likely taking a balanced approach to limit USD strength and slow yields uptrend. The Fed wants to tighten monetary conditions when they believe the time is correct, and not have tighter policy forced on the US by the market. After recent US data disappointments, robust new home sales at 481k was a positive result. With labor market data coming in particularly strong , it’s only a matter of time before we start to see wage prices improve (next week payroll will be watched). Given this base scenario we expected the Fed will be ready to changed its guidance at April 29th rate decisions meeting. Today’s inflation read will be critical test of our view. A significant erosion in core CPI might make use reconsider our call for Aprils removal of “patient” from the Feds conversation. Despite short term liquidations of overbought USD long, we remain constructive on the USD based on policy divergance.

| Today's Key Issues | Country / GMT |
|---|---|
| Jan Trade Balance, last 0.4B | SEK / 08:30 |
| Jan Household Lending YoY, last 6.10% | SEK / 08:30 |
| Feb Unemployment Change (000's), last -9K | EUR / 08:55 |
| Feb Unemployment Rate, last 6.50% | EUR / 08:55 |
| Jan M3 Money Supply YoY, last 3.60% | EUR / 09:00 |
| Jan M3 3-month average, last 3.10% | EUR / 09:00 |
| Dec Retail Sales MoM, last 0.10% | EUR / 09:00 |
| Dec Retail Sales YoY, last -2.30% | EUR / 09:00 |
| Feb Consumer Confidence Index, last 104 | EUR / 10:00 |
| Feb Business Confidence, last 97.1 | EUR / 10:00 |
| Feb Economic Sentiment, last 91.6 | EUR / 10:00 |
| Feb Business Climate Indicator, last 0.16 | EUR / 10:00 |
| Feb Industrial Confidence, last -5 | EUR / 10:00 |
| Feb F Consumer Confidence | EUR / 10:00 |
| Feb Economic Confidence, last 101.2 | EUR / 10:00 |
| Feb Services Confidence, last 4.8 | EUR / 10:00 |
| Jan Hourly Wages MoM, last 0.00% | EUR / 11:00 |
| Jan Hourly Wages YoY, last 1.10% | EUR / 11:00 |
| Jan CPI NSA MoM, last -0.70% | CAD / 13:30 |
| Jan CPI MoM, last -0.40% | USD / 13:30 |
| Jan CPI YoY, last 1.50% | CAD / 13:30 |
| Jan CPI Ex Food and Energy MoM, last 0.00% | USD / 13:30 |
| Jan CPI Core MoM, last -0.30% | CAD / 13:30 |
| Jan CPI YoY, last 0.80% | USD / 13:30 |
| Jan CPI Core YoY, last 2.20% | CAD / 13:30 |
| Jan CPI Ex Food and Energy YoY, last 1.60% | USD / 13:30 |
| Jan CPI SA MoM, last -0.10% | CAD / 13:30 |
| Jan CPI Index NSA, last 234.812 | USD / 13:30 |
| Jan CPI Core SA MoM, last 0.20% | CAD / 13:30 |
| Jan CPI Core Index SA, last 239.339 | USD / 13:30 |
| Jan Consumer Price Index, last 124.5 | CAD / 13:30 |
| Jan Durable Goods Orders, last -3.40%, rev -3.30% | USD / 13:30 |
| Jan Durables Ex Transportation, last -0.80% | USD / 13:30 |
| Jan Cap Goods Orders Nondef Ex Air, last -0.60%, rev -0.10% | USD / 13:30 |
| Jan Cap Goods Ship Nondef Ex Air, last -0.20%, rev 0.20% | USD / 13:30 |
| 21.févr. Initial Jobless Claims | USD / 13:30 |
| 14.févr. Continuing Claims | USD / 13:30 |
| Dec FHFA House Price Index MoM, last 0.80% | USD / 14:00 |
| 4Q House Price Purchase Index QoQ, last 0.90% | USD / 14:00 |
| 22.févr. Bloomberg Consumer Comfort | USD / 14:45 |
| Feb Kansas City Fed Manf. Activity, last 3 | USD / 16:00 |
The Risk Today
Peter Rosenstreich
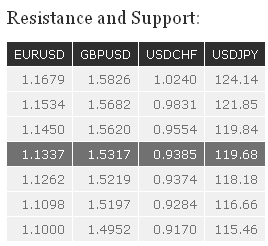
EUR/USD EUR/USD continues to move sideways within the range defined by the support at 1.1262 and the resistance at 1.1450. Another support stands at 1.1098, while another resistance can be found at 1.1534. In the longer term, the symmetrical triangle favours further weakness towards parity. As a result, any strength is likely to be temporary in nature. Key resistances stand at 1.1679 (21/01/2015 high) and 1.1871 (12/01/2015 high). Key supports can be found at 1.1000 (psychological support) and 1.0765 (03/09/2003 low).
GB/PUSD GBP/USD has broken the resistance at 1.5486, opening the way for a test of the key resistance at 1.5620. Hourly supports can now be found at 1.5468 (intraday low) and 1.5402 (24/02/2015 low, see also the rising trendline). In the longer term, the break of the key resistance at 1.5274 (06/01/2015 high) suggests renewed buying interest. Upside potentials are likely given by the resistances at 1.5620 (31/12/2014 high) and 1.5826 (27/11/2014 high). A strong support stands at 1.4814.
USD/JPY USD/JPY made an intraday bearish reversal on 24 February, indicating exhaustion in the short-term buying interest. Monitor the support at 118.18 (see also the longer-term rising trendline). Hourly resistances now lie at 119.09 (intraday high) and 119.84 (24/02/2015 high). Another support can be found at 116.66. A long-term bullish bias is favoured as long as the key support 110.09 (01/10/2014 high) holds. Even if a medium-term consolidation is likely underway, there is no sign to suggest the end of the long-term bullish trend. A gradual rise towards the major resistance at 124.14 (22/06/2007 high) is favoured. A key support can be found at 115.57 (16/12/2014 low).
USD/CHF USD/CHF remains thus far below the resistance at 0.9554. An hourly support can be found at 0.9466 (25/02/2015 low). A break of the support at 0.9374 (20/02/2015 low) is needed to invalidate the current bullish momentum. Following the removal of the EUR/CHF floor, a major top has been formed at 1.0240. The break of the resistance implied by the 61.8% retracement of the sell-off suggests a strong buying interest. Other key resistances stand at 0.9554 (16/12/2014 low) and 0.9831 (25/12/2014 low). A key support can be found at 0.9170 (30/01/2015 low).

