If you were already skeptical of the quarterly GDP reports as the basis for making informed decisions about investing and business strategy, yesterday’s article from Floyd Norris at The New York Times is sure to increase your suspicion that these figures are of dubious value. Norris digs a bit deeper into the strange case of a reported 2.9% contraction in Q1 while “employers hired more people than in any quarter over the last six years, signaling gathering strength in the economy.”
In late-April, a few days before the Bureau of Economic Analysis (BEA) released its first estimate of Q1 GDP, I published a nowcast that projected quarterly economic growth of 2.4%. That turned out to be far too optimistic vs. the reported 0.1% gain in BEA’s “advance” estimate, which was later revised down to a 2.9% decrease. My relatively upbeat approximation of Q1 growth at the time wasn’t an outlier. On the eve of the government’s initial Q1 release, the average expected rise was 1.5% via The Wall Street Journal’s survey of economists. Consider too that that the April 21 update of the Chicago Fed National Activity Index for March showed that the economy was expanding at an average rate relative to its historical trend (based on the three-month average). Meanwhile, Norris writes that Dean Maki, Barclays Capital’s chief US economist,
put together a model that uses other available data — hours worked, industrial production and new claims for unemployment insurance — to estimate G.D.P. In the past, he said, that model has done a reasonably good job of estimating the change in real G.D.P. going back to 1967. For the first quarter, it estimates a growth rate of 3 percent, rather than the official figure of a 2.9 percent decline. That is the largest discrepancy ever.
Why such a huge gap? It seems to be linked to healthcare spending and the complicated rollout of Obamacare (the Affordable Care Act). Whatever the explanation, there’s still a statistical chasm between Q1 GDP data and several key economic indicators, starting with employment. Just yesterday we learned that initial jobless claims fell last week, close to a seven-year low. That’s an encouraging signal for expecting that the recent run of stronger growth in payrolls will continue.
In fact, a broad review of economic indicators through May, along with the early data releases published to date for June, imply that recession risk is low. The Q1 GDP report suggests otherwise. Viewed in isolation, the 2.9% contraction in the first three months of this year (seasonally adjusted annual rate) is on par with the dark days of the Great Recession. Yet growth remains conspicuous in a wide spectrum of indicators, albeit with one glaring and questionable exception.
The lesson, of course, is that GDP, while it has its uses, is a poor metric for judging the macro trend in real time. The crowd gets worked up about this number, but history suggests (recent history in particular) that we should look elsewhere. Indeed, there are too many moving parts and assumptions in GDP’s calculation process to see this data as anything more than a very rough approximation of the trend–and even that may be assuming too much at times. As Diane Coyle writes in her new bio of this number -- GDP: A Brief but Affectionate History -- “GDP is the way we measure and compare how well or badly countries are doing. But this is not a question of measuring a natural phenomenon like land mass or average temperature to varying degrees of accuracy. GDP is a made-up entity.”
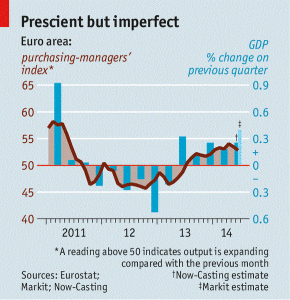
There are better ways to measure economic conditions, such as business surveys, which have an encouraging record, as The Economist points out in this week’s edition:
The first official estimates of quarterly GDP are generally published between four and six weeks after each quarter has finished. Interpreting them can be fraught since they are frequently revised. Such delays and uncertainties have led economy-watchers to search for other gauges.
Simply asking business-folk what they think is a venerable tradition—Britain’s Industrial Trends for example dates back to 1958—but such surveys are flourishing as never before. Among the most influential are purchasing-manager indices (PMIs). Every month managers in both manufacturing and private services are asked whether their firms’ output, employment, orders and the like have expanded or contracted (compared with the previous month). An index based on the net balance of their answers shows expansion above the level of 50 and contraction below it.
These findings can in turn be used to estimate the current rate of growth, given the previous relationship between the indices and GDP. For example, Markit, a research group, reported this week that their composite index for manufacturing and services in the euro zone stood at 52.8 in June. The survey suggests the euro area should grow by around 0.4% in the second quarter, twice as fast as in the first, says Chris Williamson, an economist at Markit.
Markit’s estimate of second quarter euro-zone GDP growth appeared six weeks before the first official estimate. Such surveys have other benefits: the method is transparent and easy to grasp. And the findings are not revised once the final reports emerge a week after the “flash” estimates.

True, every data set comes with its own set of baggage and so every number deserves some degree of doubt. But in the dark art of real-time estimates and looking ahead, focusing on relatively high frequency indicators, drawn from various corners of the economy, has proven to be superior to the quarterly dinosaur known as GDP. For those who think otherwise, the US economic trend looks radically different compared with the moderately positive profile painted by employment, industrial production, retail spending, and other metrics.
