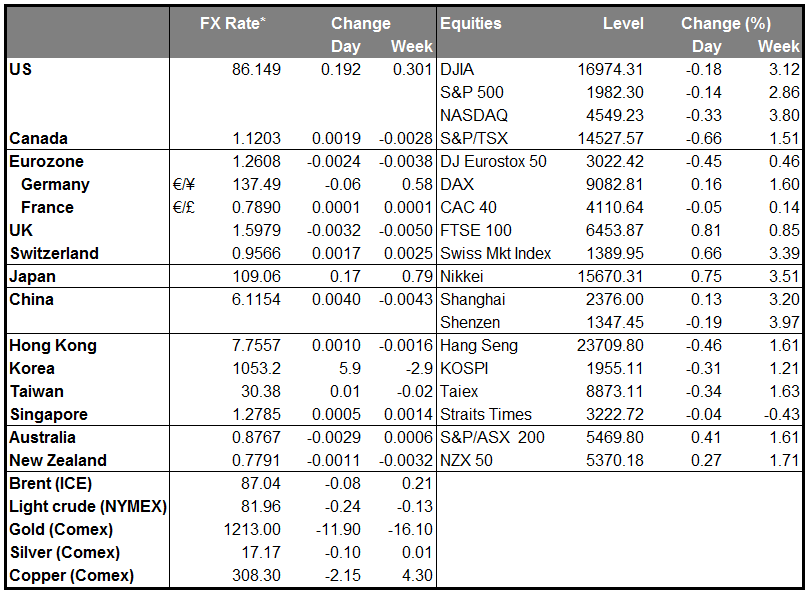
The dollar surged after a slightly hawkish Fed statement
The Federal Reserve officially announced an end to its QE3 program, as was widely expected, and expressed confidence that the US recovery remained on a stable path. In the statement following the two-day meeting, the Fed dropped the characterization of the US labor market slack as “significant” and appeared confident in the economy’s prospects. The Committee retained however the phrase to keep interest rates near zero for a “considerable time”, following the end of its asset purchase program this month. They noted though, that this should happen especially if projected inflation continues to run below the Fed’s 2% target. Nevertheless, the Committee suggested that if incoming information indicates faster progress toward the Fed’s employment and inflation objectives, then increases in the target range for the federal funds rate are likely to occur sooner than currently anticipated.
The FOMC statement strengthened the greenback against all of its major peers and pushed the Dollar index to an almost four-week high. I believe that the dollar probably ended its corrective phase and following the positive statement it should regain its glamour boosted by the relative strength of the US economy and that the policy divergence driving USD strength still exists.
The USD gained the most against the New Zealand dollar, which tumbled after the Reserve Bank of New Zealand kept its official interest rate at 3.5%. Yet, the Bank pointed to remain on hold before considering any changes. In the statement accompanying the decision, Governor Graeme Wheeler removed the phrase “we expect some further policy tightening will be necessary”, which gave no indication when the Bank might consider raising rates again. This pushed expectations for the next rate hike out to late next year. The RBNZ Governor repeated, that high NZD remained "unjustified and unsustainable". Bearing this in mind, I would expect the “on-hold” stance of the RBNZ to weigh on the Kiwi, especially against its US counterpart.
As for today’s economic indicators, the preliminary German CPI for October is forecast to accelerate to +0.9% yoy, from +0.8% in September. As usual the drama will start several hours earlier when the CPI for Saxony is released ahead of the country’s headline CPI. Market consensus of a rise in the inflation rate could strengthen somewhat the EUR. The country’s unemployment rate for October is also coming out. In Eurozone, final consumer confidence for October is anticipated to remain unchanged from its September’s print.
In the UK, the Nationwide house price index for October is coming out.
From the US, we have the 1st estimate of GDP for Q3 which is expected to show a rise of +3.0% qoq SAAR, down from +4.6% qoq SAAR in Q2. The 1st estimate of the core personal consumption index, the Fed’s favorite inflation measure, is forecast to have declined from the Fed’s 2% target. The softer growth could be offset by the lower fuel prices and the US could stay on a positive path, although at a slower pace. On the other hand, the ease in inflation rate could add to worries over the US recovery. Initial jobless claims for the week ended Oct.25 are also due out.
In New Zealand, building permits for September are forecast to accelerate, following a stalled activity in the previous month.
As for speakers: Fed Chair Janet Yellen speaks but she is not expected to take any questions and ECB Governor Luis Maria Linde also speaks.
The Market
EUR/USD tumbles as Fed ends QE
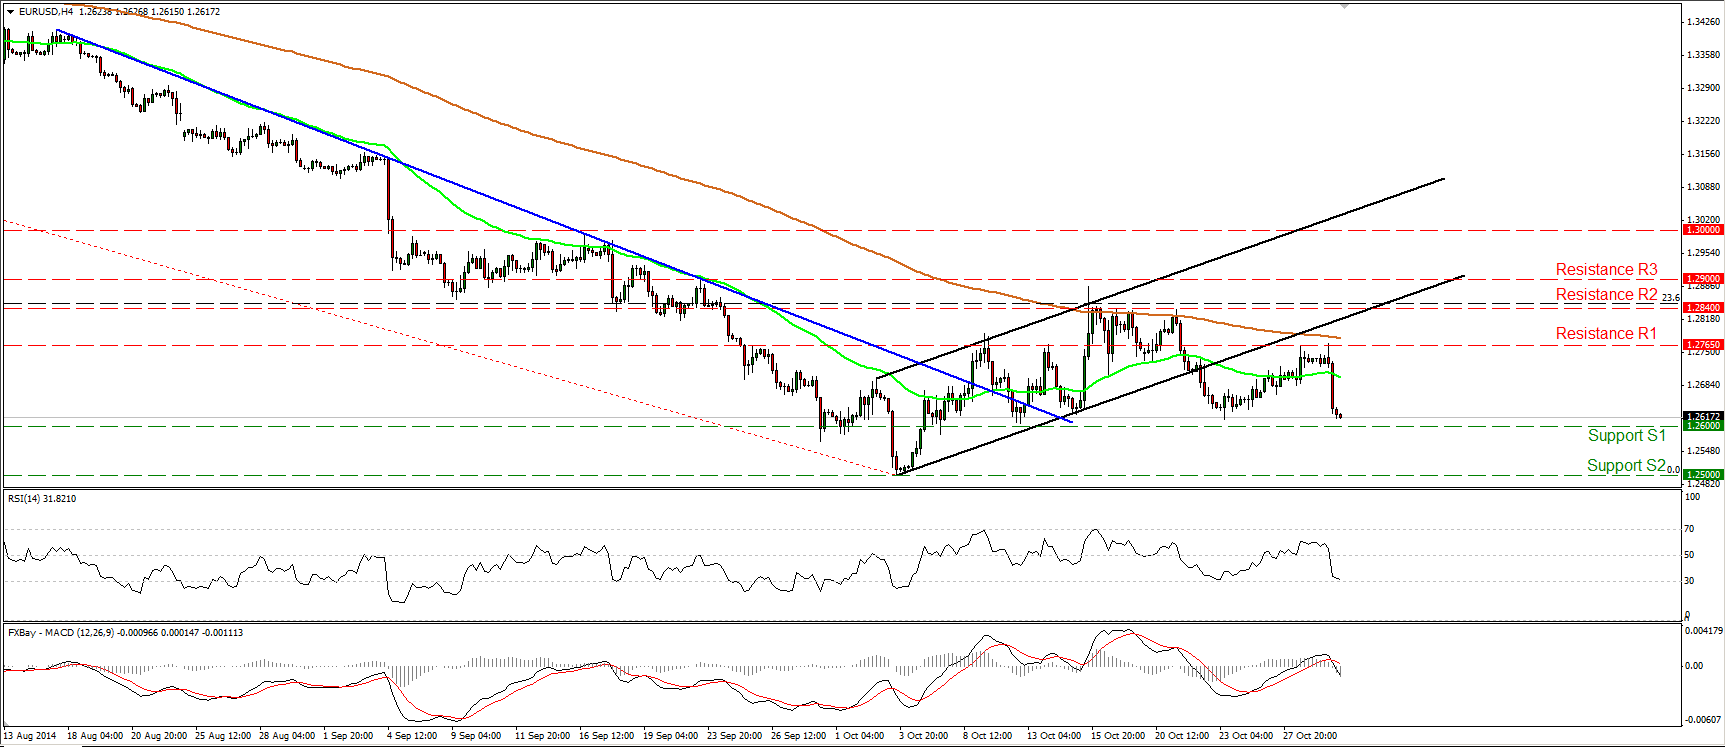
EUR/USD plunged on Wednesday after the Federal Reserve ended bond purchases and said that there has been a substantial improvement in the US labor market. The pair collapsed after finding resistance near 1.2765 (R1) and confirmed a lower high on the 4-hour chart. Today, during the early European morning, EUR/USD is trading slightly above our support line of 1.2600 (S1). As a result I will stick to the view that the pair could be resuming the prior downtrend and that the recovery from 1.2500 (S2), probably ended near the 1.2840 (R2) barrier, which happens to lie marginally below the 23.6% retracement level of the 8th of May - 3rd of October downtrend. I would wait for a dip below the 1.2600 (S1) hurdle to reaffirm the case. Such a break could open the way for another test of the psychological barrier of 1.2500 (S2), which happens to be the 76.4% retracement level of the July 2012- May 2014 major advance.
• Support: 1.2600 (S1), 1.2500 (S2), 1.2465 (S3).
• Resistance: 1.2765 (R1), 1.2840 (R2), 1.2900 (R3).
EUR/JPY pulls back
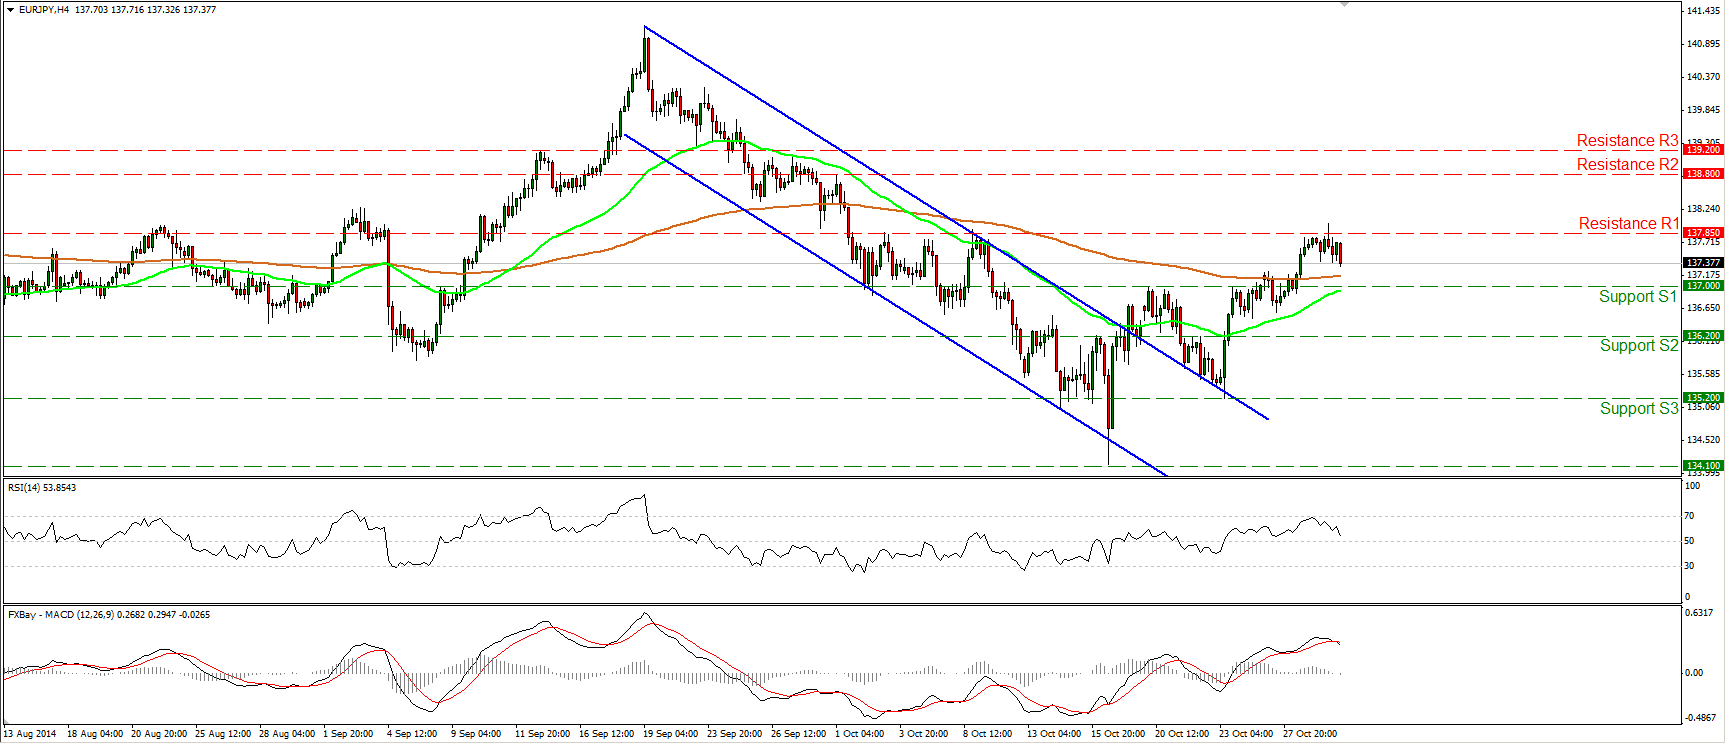
EUR/JPY pulled back yesterday after finding resistance near our 137.85 (R1) obstacle. Since the rate is still trading above both the 50- and the 200-period moving averages, I will still see a short-term uptrend. I would expect a clear and decisive break above the 137.85 (R1) to pull the trigger for another leg higher. Such a move is likely to target our next resistance area, near the 138.80 (R2) line. However, taking a look at our short-term oscillators, I would be watchful of further pullback before the bulls take control again. The RSI declined after hitting its 70 line, while the MACD topped and crossed below its trigger line.
• Support: 137.00 (S1), 136.20 (S2), 135.20 (S3).
• Resistance: 137.85 (R1), 138.80 (R2), 139.20 (R3).
NZD/USD collapses after hitting 0.7975
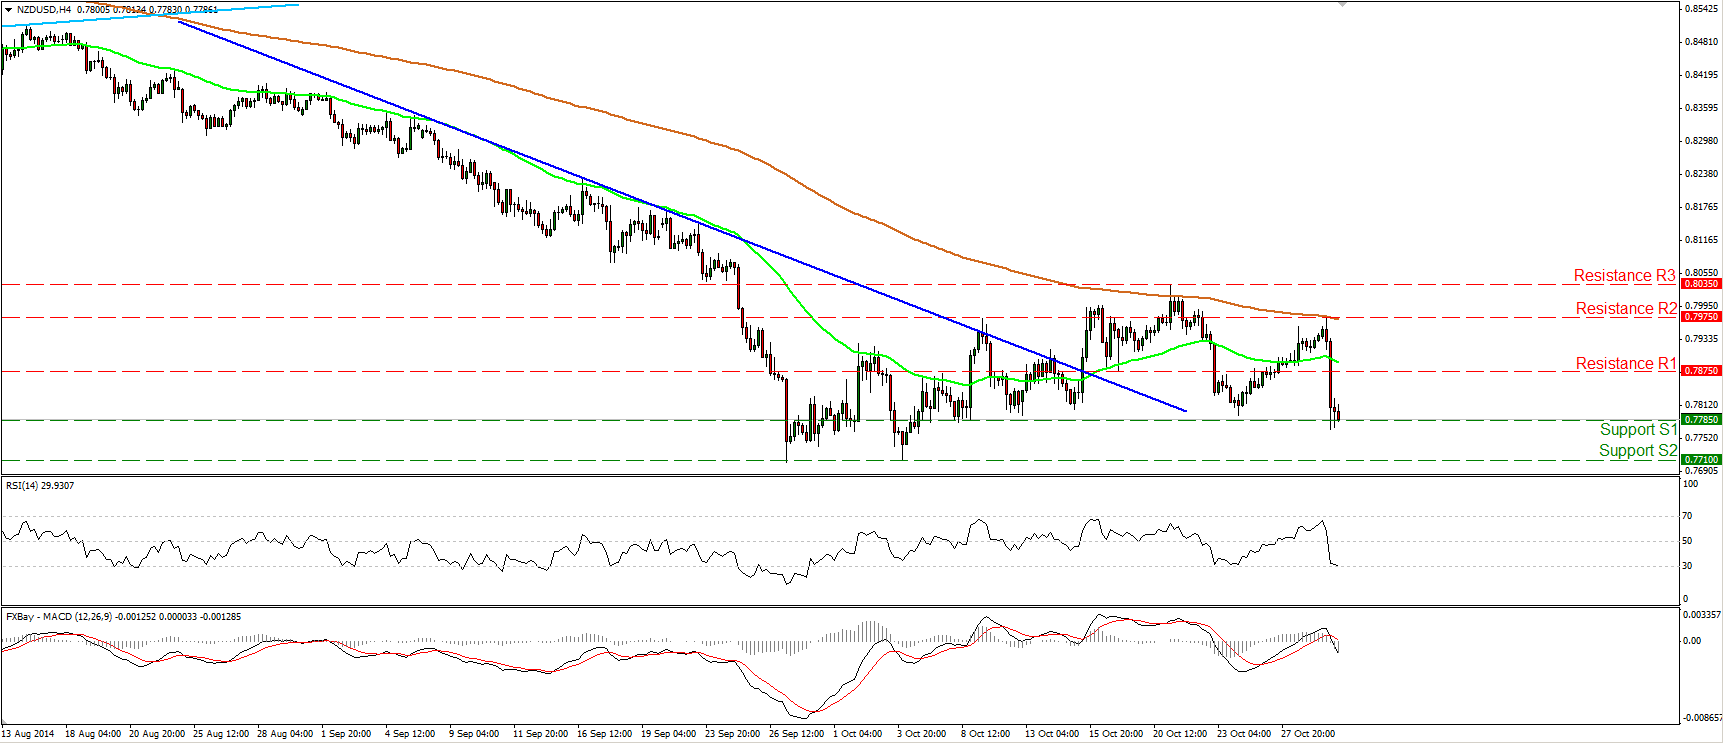
NZD/USD also collapsed on the Fed’s optimistic tone. The pair fell after finding resistance at 0.7975 (R2), near the 200-period moving average. Today, during the early European morning, the pair is testing our support line of 0.7785 (S1), where a clear break is likely to target once again the key line of 0.7710 (S2), determined by the low of the 6th of October and the low of the 29th of September. Both our momentum studies support the notion. The RSI moved lower and appears willing to cross below its 30 line, while the MACD fell below both its zero and signal lines, designating accelerating bullish momentum. On the daily chart, the 14-day RSI moved lower after finding resistance near its 50 line, while the MACD, already negative, appears willing to dip below its trigger. These momentum signs, alongside the fact that the rate is still trading below both the 50- and the 200-period moving averages, still point to a downtrend. However, I prefer to see a clear close below 0.7680 (S3), the low of June 2013 before gaining more confidence in the overall downtrend.
• Support: 0.7785 (S1), 0.7710 (S2), 0.7680 (S3).
• Resistance: 0.7875 (R1), 0.7975 (R2), 0.8035 (R3).
Gold dips below 1222
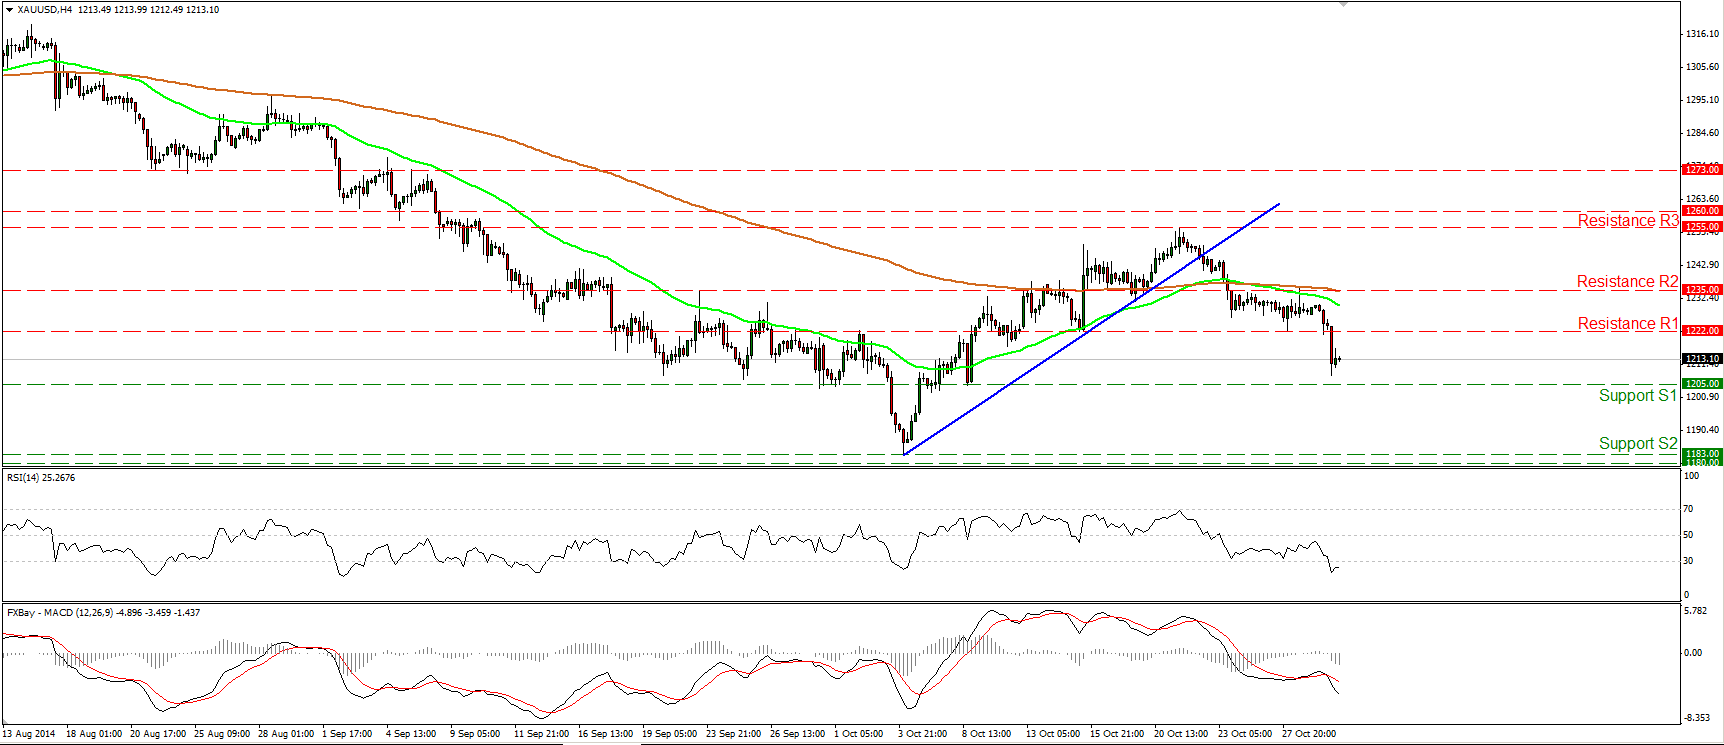
Gold also fell sharply after the FOMC decision. The metal dipped below our support (turned into resistance) line of 1222 (R1), but found support slightly above the 1205 (S1) hurdle. The dipped below the 1222 (R1) barrier flipped the picture negative again in my view, and if the bears manage to break the 1205 (S1) line, I would expect them to trigger extensions for another test at the critical support zone of 1180/83, defined by the low of the 6th of October 2014 and the lows of June and December 2013. The RSI is back within its oversold field, pointing down, while the MACD, already negative, dipped again below its signal line. This confirms yesterday’s negative momentum and amplifies the case for further declines in the close future.
• Support: 1205 (S1), 1183 (S2), 1180 (S3).
• Resistance: 1222 (R1), 1235 (R2), 1255 (R3).
WTI slightly higher
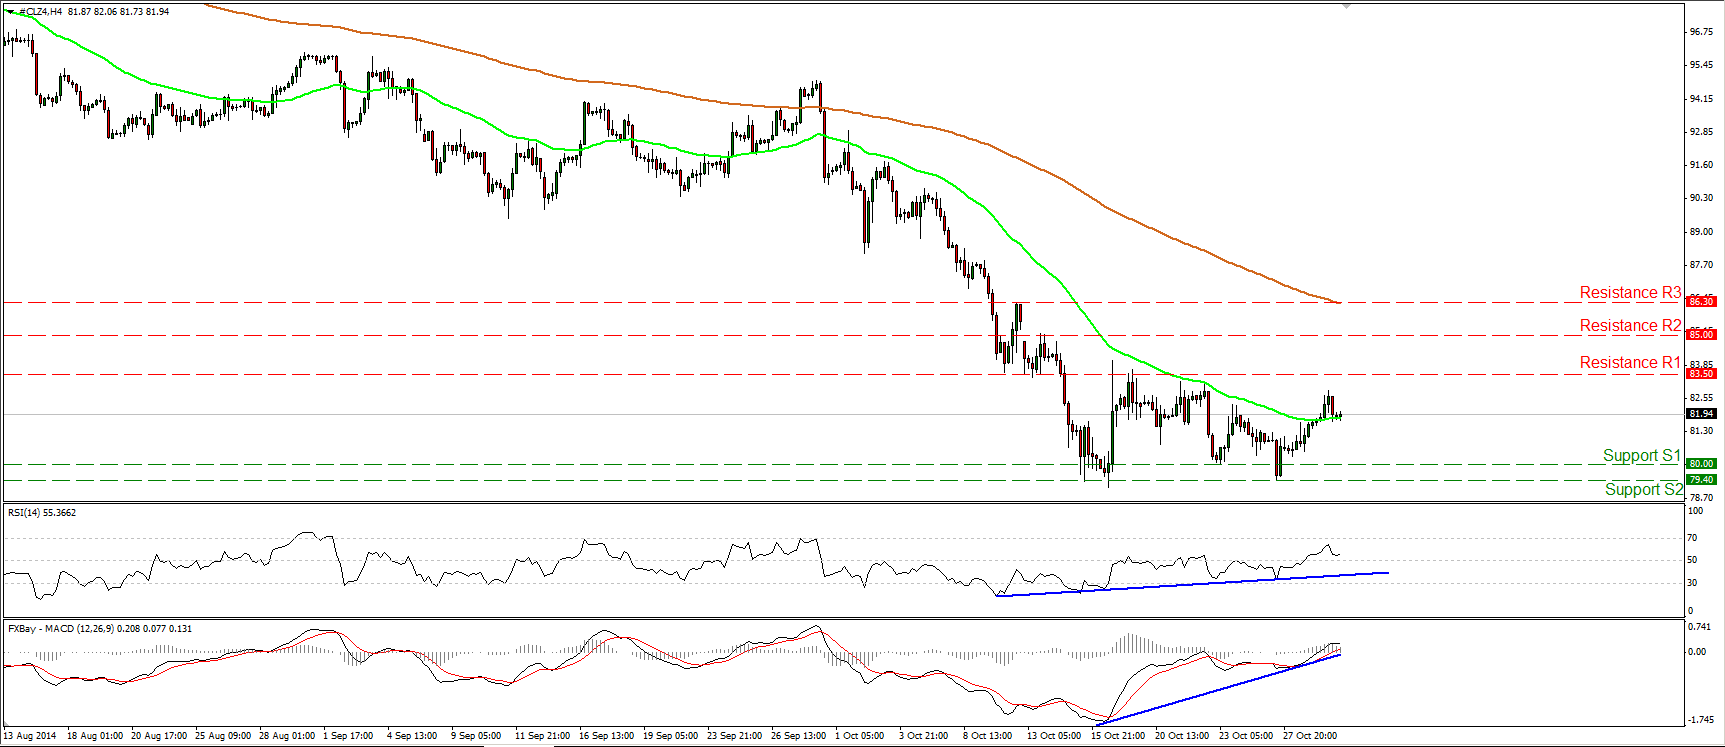
WTI continued higher on Wednesday, but remained below the resistance line of 83.50 (R1). I would maintain my neutral approach and I will repeat that a move above 83.50 (R2) is needed to flip the short-term outlook positive in my view. On the other hand, I would prefer to see a dip below 79.40 (S2), before getting more confident on the downside. My choice to stand aside is also supported by the fact that I still see positive divergence between both our short-term oscillators and the price action. In the bigger picture, although I still see a downtrend structure, the 14-day RSI exited its oversold field and moved higher, while the MACD, although below zero, has crossed above its trigger line. These momentum signs give me additional reasons to remain neutral, at least for now.
• Support: 80.00 (S1), 79.40 (S2), 79.00 (S3).
• Resistance: 83.50 (R1), 85.00 (R2), 86.30 (R3).

