
The bulk of the Q3 earnings season is now behind us, with results from only 15% of the S&P 500 members still awaited. The Retail sector is the only one at this stage that has a sizable number of reports still to come, particularly from the traditional brick-and-mortar operators like Macy’s (M) and Nordstrom (NYSE:JWN) (JWN) that will report this week. In total, we have almost 650 companies reporting Q3 results, including 31 S&P 500 members.
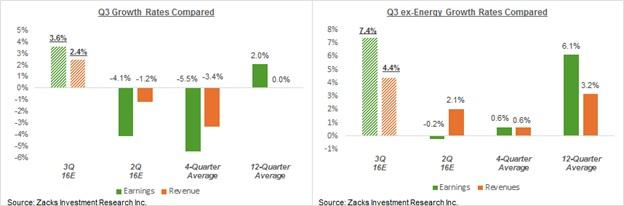
The picture emerging from the Q3 earnings season is one of overall improvement, particularly on the growth front. Earnings growth for the quarter is on track to be in positive territory, the first positive growth for the S&P 500 index after 5 quarters of back-to-back declines. The +3% earnings growth in Q3 (combining the actual results from the 423 index members that have reported already with estimates for the still-to-come 77 companies) is nevertheless a notable improvement over what we saw in the preceding 5 quarters, as the chart below shows.
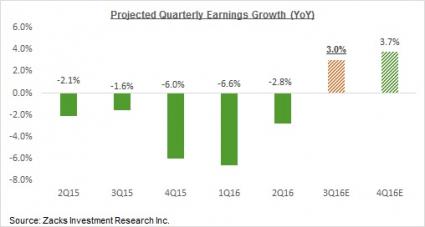
As you can see in this chart, positive growth was expected to show up in the last quarter of the year, with pre-season expectations putting Q3 growth to be in negative territory. In other words, not only has the earnings recession finally come to an end, but positive growth has arrived ahead of schedule. In a way, Q3 can be seen as an inflection point, with the growth trend shifting from negative to positive.
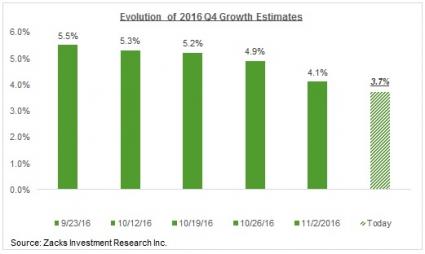
In addition to the growth angle, other favorable aspects of the Q3 earnings season pertaining to more numerous positive surprises and only modest negative revisions to Q4 estimates which have become less notable in recent days. Positive surprises are only modestly tracking above other recent periods and estimates for Q4 have started coming down, though the pace of negative revisions still compares favorably with what we had seen in the comparable periods in other recent reporting cycles. The chart below shows how estimates for Q4 have evolved since the start of the quarter.
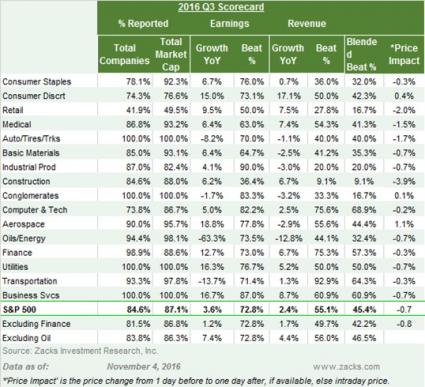
Q3 Earnings Scorecard (as of 11/04/2016)
We now have Q3 results from 423 S&P 500 members or 84.6% of the index’s total membership that combined account for 87.1% of the index’s total market capitalization. Total earnings for these 423 companies are up +3.6% from the same period last year on +2.4% higher revenues, with 72.8% beating EPS estimates and 55.1% coming ahead of revenue estimates.
The table below shows the scorecard of these 423 index members. The reporting cycle for next week has almost 650 companies reporting results, including 31 S&P 500 members. By the end of this week, we will have seen Q3 results from 90.8% of the index’s total membership.
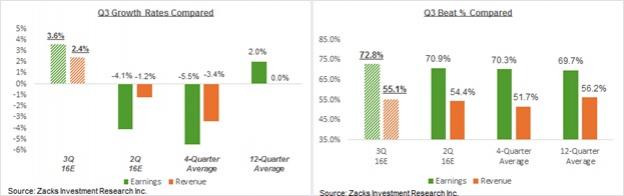
This is better performance than we have seen from the same group of 423 index members in other recent periods, as the comparison charts below show.
The Energy sector’s growth picture is expected to improve in Q4, but it remains a big drag this earnings season. Excluding the Energy sector, total earnings for the rest index members that have reported are up +7.4% on +4.4% higher revenues.
The comparison charts below show the aggregated reported picture with and without the Energy sector.
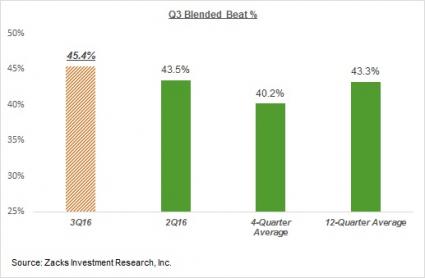
In the comparison chart below, we are comparing the proportion of S&P 500 members that are beating both EPS and revenue estimates in Q3 with historical periods. As you can see, Q3 is tracking above other recent periods largely on account of more numerous revenue beats.
Is the Improvement All Finance Driven?
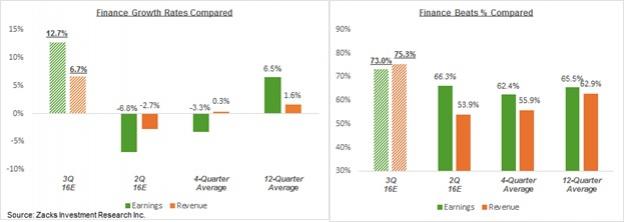
For the Finance sector, we now have Q3 results from +88.6% of the sector’s total market cap in the index. Total earnings for these companies are up +12.7% from the same period last year on +6.7% higher revenues, with 73% beating EPS and an equally high 75.3% beating revenue expectations.
This is better performance than we have seen from these Finance sector companies in a while, as the below comparison charts show.
Excluding the Finance sector from the aggregate reported picture at this stage, total earnings for the rest of S&P 500 members that have reported results will be up +1.2% on +1.7% higher revenues, with 72.8% beating EPS estimates and 49.7% beating revenue estimates.
The comparison charts below show the aggregate reported growth picture, with and without the Finance sector.
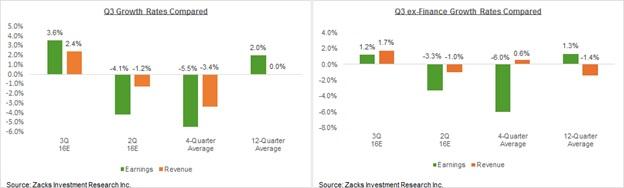
What the above chart shows is that the growth picture becomes less notable without the Finance sector, but it is still an improvement over the recent past.
Technology Sector’s Apple (NASDAQ:AAPL) Drag
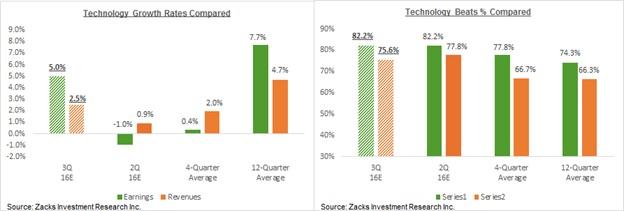
For the Technology sector, we now have Q3 results from 73.8% of the Tech companies in the S&P 500 index that combined account for 86.7% of the sector’s total market cap in the index. Total earnings for these Tech companies are up +5.0% from the same period last year on +2.5% higher revenues, with 82.2% beating EPS estimates and 75.6% beating revenue expectations.
The sector’s Q3 growth pace is nevertheless an improvement over what we have seen from the same group of Tech stocks over the past year, as the left-hand-side chart below shows. Positive surprises are also more numerous relative to historical periods (right-hand chart).
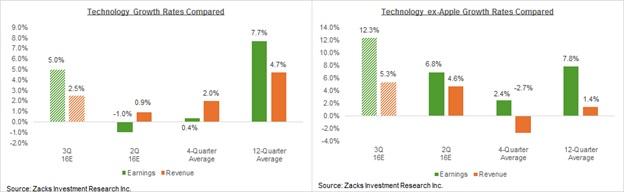
The Tech sector’s growth pace improves even more once Apple’s results are excluded from the aggregate picture. Apple’s Q3 earnings were down -19% from the same period last year on -9% lower revenues. Excluding Apple, total earnings for the rest of the Tech sector companies that have reported would be up +12.3% from the same period last year on +5.3% higher revenues.
The comparison charts below show the sector’s growth pace with and without the Apple drag. As you can see, the sector’s growth picture looks a lot better on an ex-Apple basis.
Q3 Expectations As a Whole
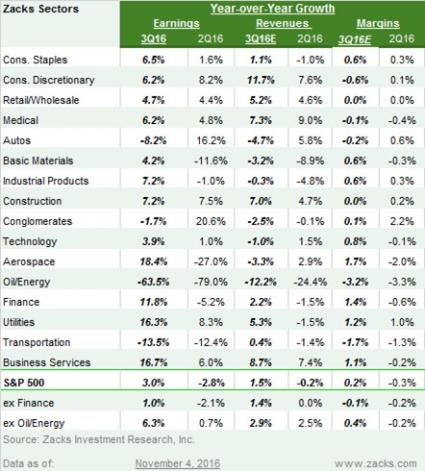
Combining the actual results from the 423 S&P 500 members with estimates from the still-to-come 77 index members, total Q3 earnings are now expected to be up +3.0% from the same period last year on +1.5% higher revenues. This would compare to 2016 Q2 earnings growth of -2.8% on -0.2% revenues.
The table below shows the summary picture for Q3 earnings, revenues and margins contrasted with the corresponding results from Q2.
Expectations Beyond Q3
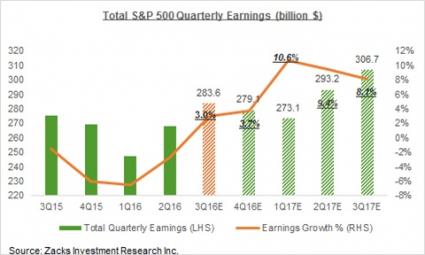
The chart below shows current bottom-up consensus earnings expectations for the index in 2016 Q3 and the following four quarters contrasted with actual results in the preceding four quarters. Please note that the columns represent bottom-up earnings totals for each quarter in billions of dollars while the line represents the quarterly growth rates.
At the start of the Q3 earnings season, growth was expected to be in negative territory for the 6th quarter in a row, with positive growth expected to resume from Q4 (+3.7%) onwards. But as indicated at the top, growth in Q3 has turned positive already (up +3.0% at present).
The Energy sector drag is expected to end in 2016 Q4 and beyond, as the chart below of the sector’s earnings shows.
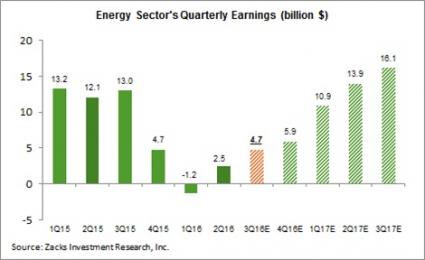
The improved Energy sector outlook makes sense, given shifting comparisons and the improvement in oil prices. But we will have to wait to find out if estimates for the other sectors will hold up as companies report Q3 results and provide guidance for Q4 and beyond.
It will be interesting to see if the decelerated pace of negative revisions that we saw the last earnings season will get repeated this time as well.
Note: Sheraz Mian regularly provides earnings analysis on Zacks.com and appears frequently in the print and electronic media. In addition to this Earnings Preview article, he publishes the Zacks Earnings Trends report every week.
If you want an email notification each time Sheraz publishes a new article, please click here>>>
Here is a list of the 645 companies reporting this week, including 31 S&P 500 member.
| Company | Ticker | Current Qtr | Year-Ago Qtr | Last EPS Surprise % | Report Day | Time |
| WESTROCK CO | WRK | 0.62 | 0.93 | 7.58% | Monday | BTO |
| SYSCO CORP | SYY | 0.59 | 0.52 | 6.67% | Monday | BTO |
| ROCKWELL AUTOMT | ROK | 1.49 | 1.57 | 6.16% | Monday | BTO |
| SCRIPPS NETWRKS | SNI | 0.93 | 1.06 | 6.76% | Monday | BTO |
| COGNIZANT TECH | CTSH | 0.75 | 0.67 | 8.22% | Monday | BTO |
| VISHAY INTERTEC | VSH | 0.25 | 0.17 | 0.00% | Monday | BTO |
| ON SEMICON CORP | ON | 0.24 | 0.23 | 5.00% | Monday | BTO |
| ARIAD PHARMA | ARIA | -0.19 | -0.29 | 670.00% | Monday | BTO |
| ARES MANAGEMENT | ARES | 0.38 | 0 | 69.23% | Monday | BTO |
| HAEMONETICS CP | HAE | 0.35 | 0.44 | -10.71% | Monday | BTO |
| PATTERN ENERGY | PEGI | -0.11 | -0.14 | 300.00% | Monday | BTO |
| TG THERAPEUTICS | TGTX | -0.31 | -0.28 | -13.79% | Monday | BTO |
| NATL HEALTH INV | NHI | 1.25 | 1.21 | 0.83% | Monday | BTO |
| FLAMEL TECH | FLML | -0.07 | 0.04 | -128.57% | Monday | BTO |
| CORE-MARK HLDG | CORE | 0.44 | 0.37 | 0.00% | Monday | BTO |
| SHENANDOAH TELE | SHEN | 0.21 | 0.22 | 3.85% | Monday | BTO |
| COMPUGEN LTD | CGEN | -0.13 | -0.13 | 23.53% | Monday | BTO |
| GOL LINHAS-ADR | GOL | -0.11 | -21.3 | 104.08% | Monday | BTO |
| REGAL BELOIT | RBC | 1.26 | 1.43 | -9.52% | Monday | BTO |
| CHIMERIX INC | CMRX | -0.43 | -0.7 | 25.00% | Monday | BTO |
| BIOCRYST PHARMA | BCRX | -0.23 | -0.2 | 8.33% | Monday | BTO |
| DEAN FOODS CO | DF | 0.37 | 0.3 | -2.56% | Monday | BTO |
| WINDSTREAM HLDG | WIN | -0.46 | -0.13 | 32.56% | Monday | BTO |
| FIRST DATA CORP | FDC | 0.27 | N/A | 3.57% | Monday | BTO |
| AMICUS THERAPT | FOLD | -0.31 | -0.32 | -21.21% | Monday | BTO |
| GLOBAL PARTNERS | GLP | -0.01 | 0.16 | -22.22% | Monday | BTO |
| LENDINGCLUB CP | LC | -0.1 | 0.01 | -140.00% | Monday | BTO |
| SNYDERS-LANCE | LNCE | 0.3 | 0.26 | 7.69% | Monday | BTO |
| MGM RESORTS INT | MGM | 0.08 | 0.15 | 23.81% | Monday | BTO |
| EARTHLINK HLDGS | ELNK | -0.01 | -0.1 | 400.00% | Monday | BTO |
| EPAM SYSTEMS | EPAM | 0.54 | 0.47 | 0.00% | Monday | BTO |
| GALMED PHARMA | GLMD | -0.37 | -0.23 | -8.33% | Monday | BTO |
| HYDROGENICS CP | HYGS | -0.18 | -0.22 | -108.33% | Monday | BTO |
| HORIZON PHARMA | HZNP | 0.63 | 0.59 | -20.75% | Monday | BTO |
| KOSMOS ENERGY | KOS | -0.08 | 0.02 | 15.38% | Monday | BTO |
| PLY GEM HOLDING | PGEM | 0.68 | 0.6 | 14.81% | Monday | BTO |
| SEMGROUP CORP-A | SEMG | 0.13 | 0.11 | 157.14% | Monday | BTO |
| TEARLAB CORP | TEAR | -0.08 | -0.24 | -11.11% | Monday | BTO |
| BMC STOCK HLDGS | BMCH | 0.32 | 0.28 | 30.43% | Monday | BTO |
| CITY OFFIC REIT | CIO | 0.22 | 0.33 | 10.00% | Monday | BTO |
| CRAWFORD & CO B | CRD.B | 0.17 | 0.12 | 26.67% | Monday | BTO |
| LMI AEROSPACE | LMIA | 0.01 | 0 | 62.50% | Monday | BTO |
| ALTISOURCE RESI | RESI | -0.74 | -0.09 | -405.26% | Monday | BTO |
| COLONY STARWOOD | SFR | 0.39 | 0.43 | 0.00% | Monday | BTO |
| SAPIENS INTL NV | SPNS | 0.12 | 0.11 | 0.00% | Monday | BTO |
| XENIA HTLS&RSRT | XHR | 0.55 | 0.57 | 3.17% | Monday | BTO |
| CONCORDIA INTL | CXRX | 1.03 | 1.31 | -18.24% | Monday | BTO |
| ENTERCOM COMMUN | ETM | 0.25 | 0.23 | -4.17% | Monday | BTO |
| MERUS BV | MRUS | -0.51 | N/A | 13.46% | Monday | BTO |
| ASANKO GOLD INC | AKG | N/A | -0.02 | -100.00% | Monday | BTO |
| ARQULE INC | ARQL | -0.09 | -0.04 | 12.50% | Monday | BTO |
| SOTHEBYS | BID | -0.62 | -0.26 | 43.81% | Monday | BTO |
| CAMTEK LIMITED | CAMT | 0.05 | 0.03 | 100.00% | Monday | BTO |
| COLONY CAPITAL | CLNY | 0.54 | 0.27 | 63.41% | Monday | BTO |
| GRAN TIERRA EGY | GTE | 0.02 | -0.03 | - | Monday | BTO |
| NOBILIS HEALTH | HLTH | 0.08 | 0.05 | 500.00% | Monday | BTO |
| KELLY SVCS A | KELYA | 0.43 | 0.23 | -6.45% | Monday | BTO |
| MEETME INC | MEET | 0.1 | 0.09 | 14.29% | Monday | BTO |
| PROGENICS PHARM | PGNX | 0.51 | -0.14 | 27.27% | Monday | BTO |
| TETRA TECH DEL | TTI | -0.04 | 0.17 | 11.76% | Monday | BTO |
| BLUERCK RG REIT | BRG | 0.05 | 0.22 | 75.00% | Monday | BTO |
| PLUG POWER INC | PLUG | -0.05 | -0.06 | 33.33% | Monday | BTO |
| MANITOWOC FOODS | MFS | 0.17 | N/A | -25.00% | Monday | BTO |
| MGM GROWTH PPTY | MGP | 0.5 | N/A | 3.23% | Monday | BTO |
| CARDIOME PHARMA | CRME | -0.22 | -0.31 | -105.56% | Monday | BTO |
| FERRARI NV | RACE | 0.54 | 0.56 | 32.61% | Monday | BTO |
| BLUE NILE INC | NILE | 0.12 | 0.17 | -14.29% | Monday | BTO |
| SANCHEZ ENERGY | SN | -0.06 | -0.5 | -187.50% | Monday | BTO |
| TRANSGLOBE ENGY | TGA | -0.07 | -0.19 | -60.00% | Monday | BTO |
| HSN INC | HSNI | 0.53 | 0.7 | 5.71% | Monday | BTO |
| MATRIX SERVICE | MTRX | 0.37 | 0.37 | 6.25% | Monday | BTO |
| GENERAL FINANCE | GFN | -0.06 | -0.08 | -33.33% | Monday | BTO |
| INTL F & F | IFF | 1.41 | 1.39 | 4.26% | Monday | AMC |
| ALBEMARLE CORP | ALB | 0.81 | 0.9 | 9.00% | Monday | AMC |
| MARRIOTT INTL-A | MAR | 0.9 | 0.78 | 5.10% | Monday | AMC |
| PRICELINE.COM | PCLN | 28.4 | 24.26 | 11.70% | Monday | AMC |
| MICROCHIP TECH | MCHP | 0.76 | 0.59 | -1.47% | Monday | AMC |
| PERKINELMER INC | PKI | 0.66 | 0.66 | 1.52% | Monday | AMC |
| NEWS CORP NEW-A | NWSA | -0.01 | 0.05 | -16.67% | Monday | AMC |
| NEWS CORP-B | NWS | -0.01 | 0.05 | -16.67% | Monday | AMC |
| INFINITY PHARMA | INFI | -0.86 | 0.84 | 51.69% | Monday | AMC |
| INVITAE CORP | NVTA | -0.67 | -0.71 | -4.05% | Monday | AMC |
| ULTRAGENYX PHAR | RARE | -1.56 | -1.03 | 0.68% | Monday | AMC |
| PREMIER INC-A | PINC | 0.37 | 0.32 | -45.71% | Monday | AMC |
| CATALENT INC | CTLT | 0.13 | 0.14 | -3.77% | Monday | AMC |
| BLACK STONE MNL | BSM | 0.12 | 0.27 | -172.73% | Monday | AMC |
| RESOLUTE ENERGY | REN | 0.56 | -0.7 | -100.00% | Monday | AMC |
| TREX COMPANY | TREX | 0.41 | 0.26 | 9.72% | Monday | AMC |
| DICERNA PHARMA | DRNA | -0.87 | -0.82 | 10.71% | Monday | AMC |
| RED ROCK RESRTS | RRR | 0.27 | N/A | -40.00% | Monday | AMC |
| SOUTHWEST GAS | SWX | 0.01 | -0.1 | 5.56% | Monday | AMC |
| ANDERSONS INC | ANDE | 0.22 | -0.04 | -25.00% | Monday | AMC |
| EVOLUTION PETRO | EPM | 0.05 | 0.09 | 350.00% | Monday | AMC |
| MATSON INC | MATX | 0.69 | 1.08 | 0.00% | Monday | AMC |
| CALADRIUS BIOSC | CLBS | -1.23 | -2.1 | 11.33% | Monday | AMC |
| OASIS PETROLEUM | OAS | -0.2 | 0.09 | 26.67% | Monday | AMC |
| ALIGN TECH INC | ALGN | 0.51 | 0.34 | 29.17% | Monday | AMC |
| FRANCO NV CP | FNV | 0.24 | 0.12 | 10.00% | Monday | AMC |
| NEVRO CORP | NVRO | -0.39 | -0.7 | 41.30% | Monday | AMC |
| ONEMAIN HOLDNGS | OMF | 1.07 | 0.5 | 46.00% | Monday | AMC |
| AMC ENTERTAINMT | AMC | 0.28 | 0.12 | -17.24% | Monday | AMC |
| KARYOPHARM THER | KPTI | -0.8 | -0.85 | -10.53% | Monday | AMC |
| LIVE NATION ENT | LYV | 0.48 | 0.44 | 85.71% | Monday | AMC |
| ACADIA PHARMA | ACAD | -0.55 | -0.39 | -31.25% | Monday | AMC |
| NATL CINEMEDIA | NCMI | 0.13 | 0.13 | -21.43% | Monday | AMC |
| TPG SPECIALTY | TSLX | 0.43 | 0.48 | 2.38% | Monday | AMC |
| CHEGG INC | CHGG | -0.17 | -0.23 | 11.11% | Monday | AMC |
| FATE THERAPEUTC | FATE | -0.28 | -0.24 | 6.45% | Monday | AMC |
| FOGO DE CHAO | FOGO | 0.15 | 0.18 | -12.00% | Monday | AMC |
| FIESTA RESTRNT | FRGI | 0.32 | 0.33 | -15.00% | Monday | AMC |
| HALOZYME THERA | HALO | -0.27 | -0.19 | 19.23% | Monday | AMC |
| JACK HENRY ASSC | JKHY | 0.7 | 0.64 | 32.50% | Monday | AMC |
| OUTFRONT MEDIA | OUT | 0.53 | 0.5 | 7.27% | Monday | AMC |
| PACIFIC DRILLNG | PACD | -1.02 | 1.9 | 94.85% | Monday | AMC |
| AGILE THERAP | AGRX | -0.35 | -0.42 | 0.00% | Monday | AMC |
| ACHOGEN INC | AKAO | -0.55 | -0.48 | -22.73% | Monday | AMC |
| ARENA PHARMA | ARNA | -0.07 | -0.11 | 0.00% | Monday | AMC |
| CONNECTURE INC | CNXR | -0.12 | -0.11 | -123.81% | Monday | AMC |
| EDITAS MEDICINE | EDIT | -0.64 | N/A | -17.39% | Monday | AMC |
| INFORMATION SVC | III | 0.04 | 0.07 | 20.00% | Monday | AMC |
| ORMAT TECH INC | ORA | 0.48 | 0.46 | 16.67% | Monday | AMC |
| PRA GROUP INC | PRAA | 0.77 | 0.99 | 0.00% | Monday | AMC |
| RUDOLPH TECH | RTEC | 0.27 | 0.24 | 33.33% | Monday | AMC |
| SITEONE LANDSCP | SITE | 0.42 | N/A | -473.08% | Monday | AMC |
| ZOGENIX INC | ZGNX | -0.96 | -0.66 | 0.00% | Monday | AMC |
| ACXIOM CORP | ACXM | 0.04 | 0.07 | 300.00% | Monday | AMC |
| ASCENT CAP GRP | ASCMA | -1.18 | -2.1 | -25.87% | Monday | AMC |
| BIOSCRIP INC | BIOS | -0.06 | -0.19 | 11.11% | Monday | AMC |
| CARMIKE CINEMA | CKEC | 0.06 | -0.22 | -42.86% | Monday | AMC |
| CRAY INC | CRAY | -0.33 | 0.42 | -32.00% | Monday | AMC |
| ENVESTNET INC | ENV | 0.16 | 0.2 | -91.67% | Monday | AMC |
| FAIR ISAAC INC | FICO | 0.74 | 1.36 | 63.38% | Monday | AMC |
| FLEXION THERAPT | FLXN | -0.67 | -0.52 | 12.50% | Monday | AMC |
| MODEL N INC | MODN | -0.26 | -0.18 | 6.45% | Monday | AMC |
| MAXLINEAR INC-A | MXL | 0.32 | 0.32 | 16.22% | Monday | AMC |
| NEW RELIC INC | NEWR | -0.31 | -0.29 | 5.56% | Monday | AMC |
| OPKO HEALTH INC | OPK | -0.05 | 0.25 | 33.33% | Monday | AMC |
| PARK OHIO HLDNG | PKOH | 0.92 | 1.07 | 4.11% | Monday | AMC |
| RIGNET INC | RNET | -0.1 | 0.17 | -400.00% | Monday | AMC |
| REDWOOD TRUST | RWT | 0.38 | 0.22 | 10.81% | Monday | AMC |
| SYNCHRONOSS TEC | SNCR | 0.56 | 0.42 | 9.76% | Monday | AMC |
| VIPER ENERGY | VNOM | 0.1 | 0.08 | 12.50% | Monday | AMC |
| APPLE HOSP REIT | APLE | 0.5 | 0.46 | 1.96% | Monday | AMC |
| AQUA METALS INC | AQMS | -0.18 | -0.19 | -33.33% | Monday | AMC |
| ARDELYX INC | ARDX | -0.7 | -0.7 | -23.88% | Monday | AMC |
| CONTL BLDG PRD | CBPX | 0.29 | 0.25 | 6.90% | Monday | AMC |
| DEMAND MEDIA | DMD | -0.51 | -0.35 | 25.58% | Monday | AMC |
| DEXTERA SURGICL | DXTR | -0.48 | -0.5 | -2.13% | Monday | AMC |
| EMERGENT BIOSOL | EBS | 0.39 | 0.83 | 21.74% | Monday | AMC |
| FABRINET | FN | 0.64 | 0.38 | -8.33% | Monday | AMC |
| FORTUNA SILVER | FSM | 0.08 | 0.02 | 33.33% | Monday | AMC |
| HACKETT GROUP | HCKT | 0.2 | 0.15 | -5.26% | Monday | AMC |
| LATTICE SEMICON | LSCC | 0.04 | -0.08 | -50.00% | Monday | AMC |
| NUMEREX CP-CL A | NMRX | -0.06 | -0.18 | -114.29% | Monday | AMC |
| PORTOLA PHARMA | PTLA | -1.08 | -1.05 | 23.31% | Monday | AMC |
| ROCKWELL MED | RMTI | -0.1 | -0.05 | 8.33% | Monday | AMC |
| ROSETTA STONE | RST | -0.56 | -0.34 | 55.22% | Monday | AMC |
| STARTEK INC | SRT | 0 | -0.45 | -1000.00% | Monday | AMC |
| TUCOWS INC | TCX | 0.38 | 0.28 | -2.56% | Monday | AMC |
| TRIPLEPOINT VEN | TPVG | 0.35 | 0.28 | -11.76% | Monday | AMC |
| ENERGOUS CORP | WATT | -0.44 | -0.43 | 0.00% | Monday | AMC |
| XTANT MEDICAL | XTNT | -0.31 | -0.51 | 7.50% | Monday | AMC |
| ADDUS HOMECARE | ADUS | 0.26 | 0.25 | -9.68% | Monday | AMC |
| AMER MIDSTREAM | AMID | 0.3 | -0.12 | 14.29% | Monday | AMC |
| APPFOLIO INC-A | APPF | -0.11 | -0.14 | 36.36% | Monday | AMC |
| ATLANTIC PWR CP | AT | -0.01 | -0.05 | 6.25% | Monday | AMC |
| AMERICA FST TAX | ATAX | 0.09 | 0.04 | 87.50% | Monday | AMC |
| CHEMOCENTRYX | CCXI | N/A | -0.26 | -414.29% | Monday | AMC |
| CUTERA INC | CUTR | -0.02 | -0.07 | 200.00% | Monday | AMC |
| DATALINK CORP | DTLK | 0.1 | 0.15 | 260.00% | Monday | AMC |
| DTS INC | DTSI | 0.41 | 0.19 | 58.82% | Monday | AMC |
| EMERGENT CAPITL | EMG | -0.17 | -0.48 | 83.33% | Monday | AMC |
| FOSTER LB CO | FSTR | 0.14 | 0.67 | -157.89% | Monday | AMC |
| JP ENERGY PTN | JPEP | -0.09 | -0.23 | 40.00% | Monday | AMC |
| KINDRED BIOSCI | KIN | -0.36 | -0.36 | 19.35% | Monday | AMC |
| KURA ONCOLOGY | KURA | -0.41 | -0.57 | -5.88% | Monday | AMC |
| PERCEPTRON INC | PRCP | -0.05 | -0.23 | 214.29% | Monday | AMC |
| SALEM MEDIA GRP | SALM | 0.11 | 0.08 | 22.22% | Monday | AMC |
| SEMICON MFG-ADR | SMI | 0.08 | 0.1 | 57.14% | Monday | AMC |
| SUN HYDRAULICS | SNHY | 0.2 | 0.32 | 0.00% | Monday | AMC |
| INTERNET INIT J | IIJI | N/A | 0.08 | - | Monday | AMC |
| MONROE CAPITAL | MRCC | 0.39 | 0.36 | 12.82% | Monday | AMC |
| KINDRED HLTHCR | KND | 0.07 | 0.23 | 11.76% | Monday | AMC |
| CROSSAMERICA LP | CAPL | 0.13 | 0.29 | -33.33% | Monday | AMC |
| CST BRANDS INC | CST | 0.63 | 2.12 | -4.88% | Monday | AMC |
| HERTZ GLBL HLDG | HTZ | 2.81 | N/A | 36.67% | Monday | AMC |
| IAMGOLD CORP | IAG (LON:ICAG) | 0 | -0.12 | 133.33% | Monday | AMC |
| TIDEWATER INC | TDW | -1.11 | -0.01 | -44.44% | Monday | AMC |
| SCANSOURCE INC | SCSC | 0.65 | 0.68 | -29.17% | Monday | AMC |
| STONE ENERGY CP | SGY | -5.31 | -1.5 | -15.33% | Monday | AMC |
| LUXFER HOLDINGS | LXFR | 0.17 | 0.28 | -3.45% | Monday | AMC |
| WEYCO GROUP | WEYS | 0.33 | 0.51 | -43.75% | Monday | AMC |
| AMER PUB EDUCAT | APEI | 0.31 | 0.41 | 5.13% | Monday | AMC |
| FARMER BROS CO | FARM | 0.25 | 0.25 | -30.30% | Monday | AMC |
| A-MARK PRECIOUS | AMRK | 0.03 | 0.76 | -40.00% | Monday | AMC |
| FTD COS INC | FTD | -0.02 | -0.02 | 4.00% | Monday | AMC |
| TELECOM ITA-ADR | TI | N/A | N/A | - | Monday | N/A |
| DXP ENTERPRISES | DXPE | -0.02 | 0.44 | 440.00% | Monday | N/A |
| HSBC HOLDINGS | HSBC | N/A | 1.25 | - | Monday | N/A |
| WESTPAC BK ADR | WBK | N/A | N/A | - | Monday | N/A |
| JOHNSON CONTRLS | JCI | 1.18 | 0.64 | 1.89% | Tuesday | BTO |
| D R HORTON INC | DHI | 0.77 | 0.64 | 0.00% | Tuesday | BTO |
| CVS HEALTH CORP | CVS | 1.57 | 1.28 | 1.54% | Tuesday | BTO |
| ENDO INTL PLC | ENDP | 0.81 | 1.02 | 14.67% | Tuesday | BTO |
| NEXSTAR BRDCSTG | NXST | 0.86 | 0.54 | -6.02% | Tuesday | BTO |
| HECLA MINING | HL | 0.06 | -0.05 | 250.00% | Tuesday | BTO |
| UNIVL AMERICAN | UAM | -0.01 | -0.13 | 0.00% | Tuesday | BTO |
| DIAMONDBACK EGY | FANG | 0.34 | 0.4 | 73.33% | Tuesday | BTO |
| COMSTOCK RESOUR | CRK | -2.14 | -5.3 | -563.93% | Tuesday | BTO |
| PRIMORIS SERVCS | PRIM | 0.25 | 0.37 | -56.52% | Tuesday | BTO |
| HOUSTON WIRE&CB | HWCC | -0.03 | 0.06 | -500.00% | Tuesday | BTO |
| LIBERTY MEDIA-C | LMCK | -0.05 | -0.07 | 111.76% | Tuesday | BTO |
| MOMO INC -ADR | MOMO | 0.14 | 0 | 0.00% | Tuesday | BTO |
| IMPERIAL BRANDS | IMBBY | N/A | N/A | - | Tuesday | BTO |
| AERCAP HLDGS NV | AER | 1.42 | 1.65 | 6.99% | Tuesday | BTO |
| CINEMARK HLDGS | CNK | 0.55 | 0.4 | -9.80% | Tuesday | BTO |
| SEAWORLD ENTERT | SEAS | 1.07 | 1.14 | -8.70% | Tuesday | BTO |
| TCP CAPITAL CP | TCPC | 0.38 | 0.4 | 0.00% | Tuesday | BTO |
| NAVIOS MARI ACQ | NNA | 0.04 | 0.14 | -27.27% | Tuesday | BTO |
| ORBITAL ATK INC | OA | 1.4 | 1.35 | 3.85% | Tuesday | BTO |
| CECO ENVIRNMNTL | CECE | 0.2 | 0.27 | 10.53% | Tuesday | BTO |
| LIONBRIDGE TECH | LIOX | 0.12 | 0.1 | -21.43% | Tuesday | BTO |
| SUNSHINE HEART | SSH | N/A | -0.36 | 5.26% | Tuesday | BTO |
| TOWNSQAR MEDIA | TSQ | 0.67 | 0.33 | -9.09% | Tuesday | BTO |
| VTTI EGY PTNRS | VTTI | 0.16 | N/A | - | Tuesday | BTO |
| ALBANY MOL RSCH | AMRI | 0.13 | 0.11 | -3.03% | Tuesday | BTO |
| EASTRLY GOV PPT | DEA | 0.3 | 0.26 | 0.00% | Tuesday | BTO |
| GAMING AND LEIS | GLPI | 0.74 | 0.69 | 3.14% | Tuesday | BTO |
| HHGREGG INC | HGG | -0.39 | -0.37 | 32.26% | Tuesday | BTO |
| ICONIX BRAND GP | ICON | 0.2 | 0.09 | 17.39% | Tuesday | BTO |
| LGI HOMES INC | LGIH | 0.84 | 0.76 | 9.09% | Tuesday | BTO |
| LIBERTY MEDIA-A | LMCA | -0.4 | -0.07 | 108.51% | Latest commentsInstall Our App Risk Disclosure: Trading in financial instruments and/or cryptocurrencies involves high risks including the risk of losing some, or all, of your investment amount, and may not be suitable for all investors. Prices of cryptocurrencies are extremely volatile and may be affected by external factors such as financial, regulatory or political events. Trading on margin increases the financial risks. Before deciding to trade in financial instrument or cryptocurrencies you should be fully informed of the risks and costs associated with trading the financial markets, carefully consider your investment objectives, level of experience, and risk appetite, and seek professional advice where needed. Fusion Media would like to remind you that the data contained in this website is not necessarily real-time nor accurate. The data and prices on the website are not necessarily provided by any market or exchange, but may be provided by market makers, and so prices may not be accurate and may differ from the actual price at any given market, meaning prices are indicative and not appropriate for trading purposes. Fusion Media and any provider of the data contained in this website will not accept liability for any loss or damage as a result of your trading, or your reliance on the information contained within this website. It is prohibited to use, store, reproduce, display, modify, transmit or distribute the data contained in this website without the explicit prior written permission of Fusion Media and/or the data provider. All intellectual property rights are reserved by the providers and/or the exchange providing the data contained in this website. Fusion Media may be compensated by the advertisers that appear on the website, based on your interaction with the advertisements or advertisers. © 2007-2024 - Fusion Media Limited. All Rights Reserved. |