Today's release of the November Producer Price Index (PPI) for Final Demand came in at -0.2% month-over-month seasonally adjusted. That's down from the previous month's 0.2% increase. Core Final Demand (less food and energy) was unchanged from last month.
The year-over-year change in Final Demand is up 1.4%, the lowest since 1.2% in February.
Here is the essence of the news release on Finished Goods:
The Producer Price Index for final demand fell 0.2 percent in November, seasonally adjusted, the U.S. Bureau of Labor Statistics reported today. This decrease followed a 0.2-percent rise in October and a 0.1-percent decline in September. On an unadjusted basis, the index for final demand advanced 1.4 percent for the 12 months ended in November, the smallest 12-month increase since a 1.2-percent rise in February 2014....
In November, the 0.2-percent decline in final demand prices can be traced to the index for final demand goods, which decreased 0.7 percent. In contrast, prices for final demand services advanced 0.1 percent. More…
Finished Goods: Headline and Core
The BLS shifted its focus to its new "Final Demand" series earlier this year. I fully support this shift. However, the data for these series are only constructed back to November 2009 for Headline and April 2010 for Core. Since my focus is on longer term trends, I continue to track the legacy Producer Price Index for Finished Goods, which the BLS also includes in their monthly updates.
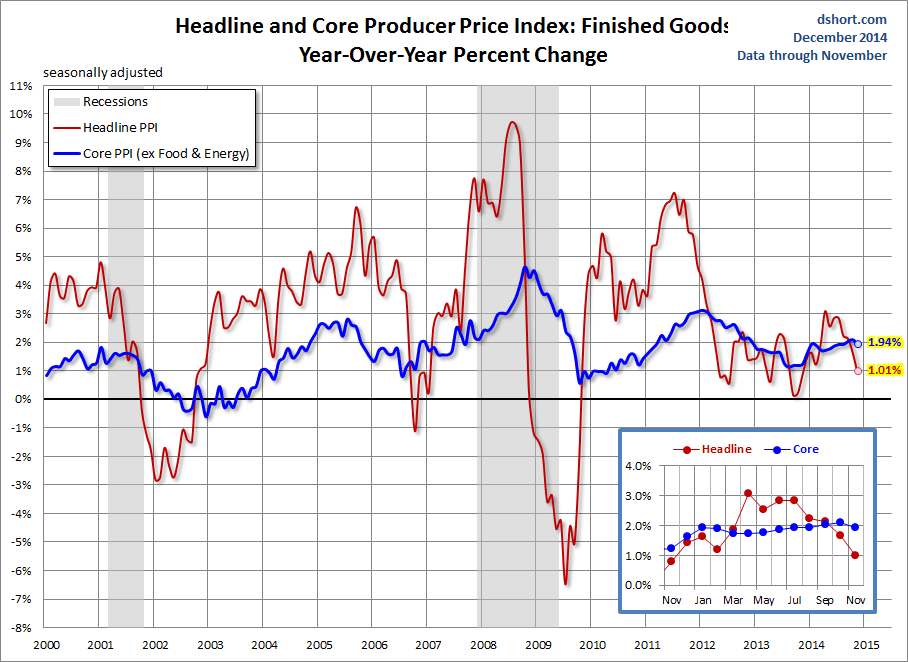
The Headline Finished Goods for November dropped 0.65% MoM and is up 1.01% YoY, down from last month's 1.67% YoY. Core Finished Goods rose were unchanged MoM and is up 1.94% YoY.
Now let's visualize the numbers with an overlay of the Headline and Core (ex food and energy) PPI for finished goods since 2000, seasonally adjusted. As we can see, the YoY trend in Core PPI (the blue line) declined significantly during 2009 and stabilized in 2010, increased in 2011 and then eased during 2012 and most of 2013, falling as low as 1.15% last August. It shot up in the early winter near the 2% benchmark and has hovered below that level for the past six months.

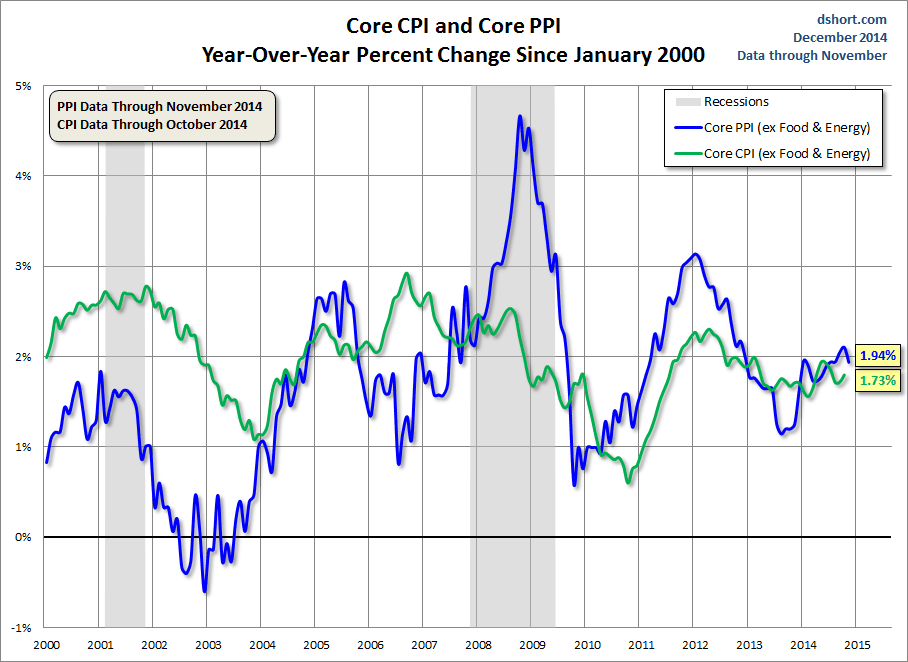
As the next chart shows, the Core Producer Price Index is far more volatile than the Core Consumer Price Index. For example, during the last recession producers were unable to pass cost increases to the consumer. Likewise in 2010 the Core PPI generally rose while Core CPI generally fell. Since 2012, Core PPI steadily trended downward but to its interim low in August of 2013. It rose in the final months of last year and has remained in a narrow range in 2014.

Check back next month for a new update.
