Talking Points
Foreign Exchange Price & Time at a Glance:

Charts Created using Marketscope – Prepared by Kristian Kerr
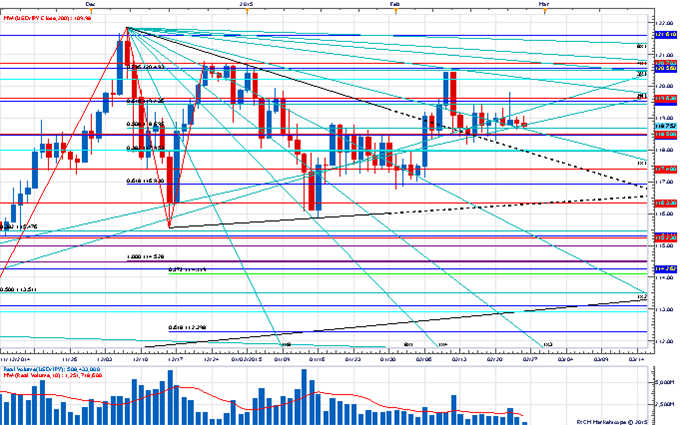
- USD/JPY continues to meander around the 50% retracement of the December range
- Our near-term trend bias is positive while above 118.40
- A move through Gann resistance at 119.60 is needed to re-instill upside momentum into the rate
- A very minor turn window is eyed tomorrow
- A close below 118.40 would turn us negative on USD/JPY
USD/JPY Strategy: Like holding only reduced longs above 118.40.
Instrument | Support 2 | Support 1 | Spot | Resistance 1 | Resistance 2 |
USD/JPY | 118.00 | *118.40 | 118.75 | 119.10 | *119.60 |

Charts Created using Marketscope – Prepared by Kristian Kerr
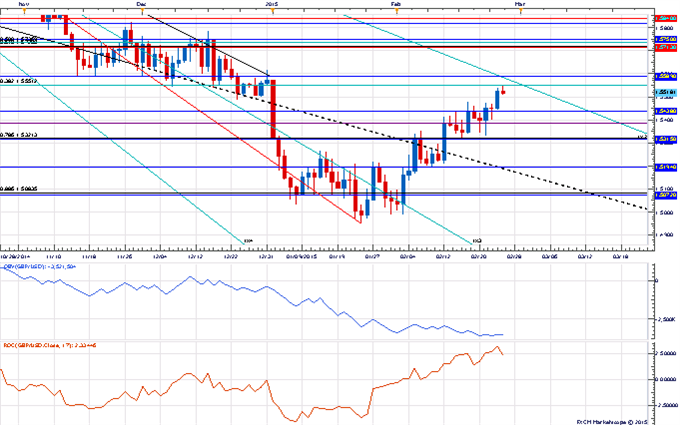
- GBP/USD recorded it highest level since the start of year today before stalling out around the 38% retracement of the September-January decline near 1.5550
- Our near-term trend bias is positive while above 1.5440
- A move through 1.5590 is needed confirm the start of a more important leg higher in Cable
- An important cyclical turn window is seen later next week
- A move under the 4th square root relationship of the year’s low at 1.5440 would turn us negative on the pound
GBP/USD Strategy: Like the long side while over 1.5440.
Instrument | Support 2 | Support 1 | Spot | Resistance 1 | Resistance 2 |
*1.5440 | 1.5480 | 1.5515 | 1.5550 | *1.5590 |
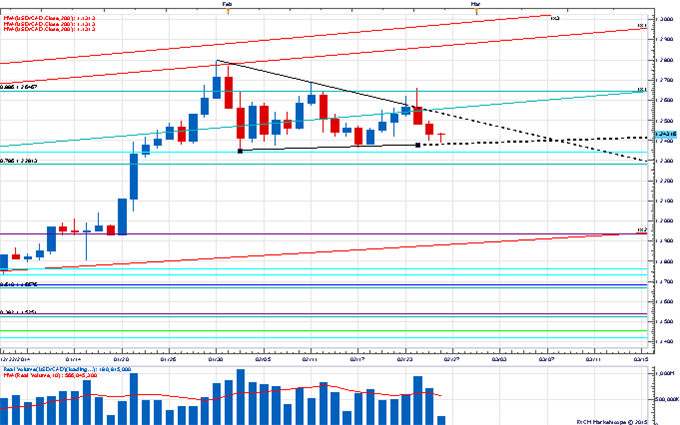
Focus Chart of the Day: USD/CAD

Some of the best directional moves in foreign exchange often stem from failed pattern breakouts. The logic is rather simple. A good portion of the market gets trapped on a technical break in one direction and is then forced to stop out as the pattern fails to materialize resulting in momentum going in the other direction. Following USD/CAD’s failed breakout attempt on Monday/Tuesday from the triangle consolidation of the past few weeks we can’t help but wonder if a false pattern scenario to the downside is about to play out? A move under the mid-February lows around 1.2360 would confirm this thinking and set the stage for a potentially serious decline in the days and weeks ahead. As long as 1.2360 holds, however, we can’t rule out the potential that USD/CAD is just still in the midst of the bullish triangle consolidation as traditional technical thinking suggests that triangle formations should play out in five legs. The last leg was missing earlier in the week, but if the exchange rate can hold 1.2360 and gain traction over 1.2570 then the upside breakout from a consolidation notion will be very much back in play.
--- Written by Kristian Kerr, Senior Currency Strategist for DailyFX.com
