Current Position of the Market
SPX Long-term trend: The long-term trend is up but weakening. Potential final phase of bull market.
SPX Intermediate trend: The uptrend from 1810 continues, but it has entered a corrective phase which could extend into November.
Analysis of the short-term trend is done on a daily basis with the help of hourly charts. It is an important adjunct to the analysis of daily and weekly charts which discuss longer market trends.
Market Overview
According to Erik Hadik (whom I consider an expert on cycles), a number of cycles are bringing increasing pressure on the market and this could result in a decline extending into mid-to-late November. If he is correct, we could start this decline as early as next week. I track a 20-week cycle which gives a similar warning.
So far, there is nothing in the charts of the DJIA or SPX that contradicts this point of view. Significant declines are nearly always preceded by a period of distribution which creates a sideways price pattern, and this is the form that the correction has taken since mid-July. The pattern is also making a rounding top which normally results in a decline which is proportionate to the amount of distribution which has taken place.
I recently mentioned that the DJIA could be the early bird, because it is beginning to crowd a trend line which starts at the February lows. It has been breaching that trend line by a few points practically on a daily basis over the past two weeks, but has rallied each time.
Friday it closed right on it! There is also a trend line which is drawn across the declining tops and which is now making an apex with the one which rises. Time is running out and the index has to decide if it is going to go up or down from here. If Hadik is right, down is the only choice and this could happen at any time.
Analysis
Daily chart
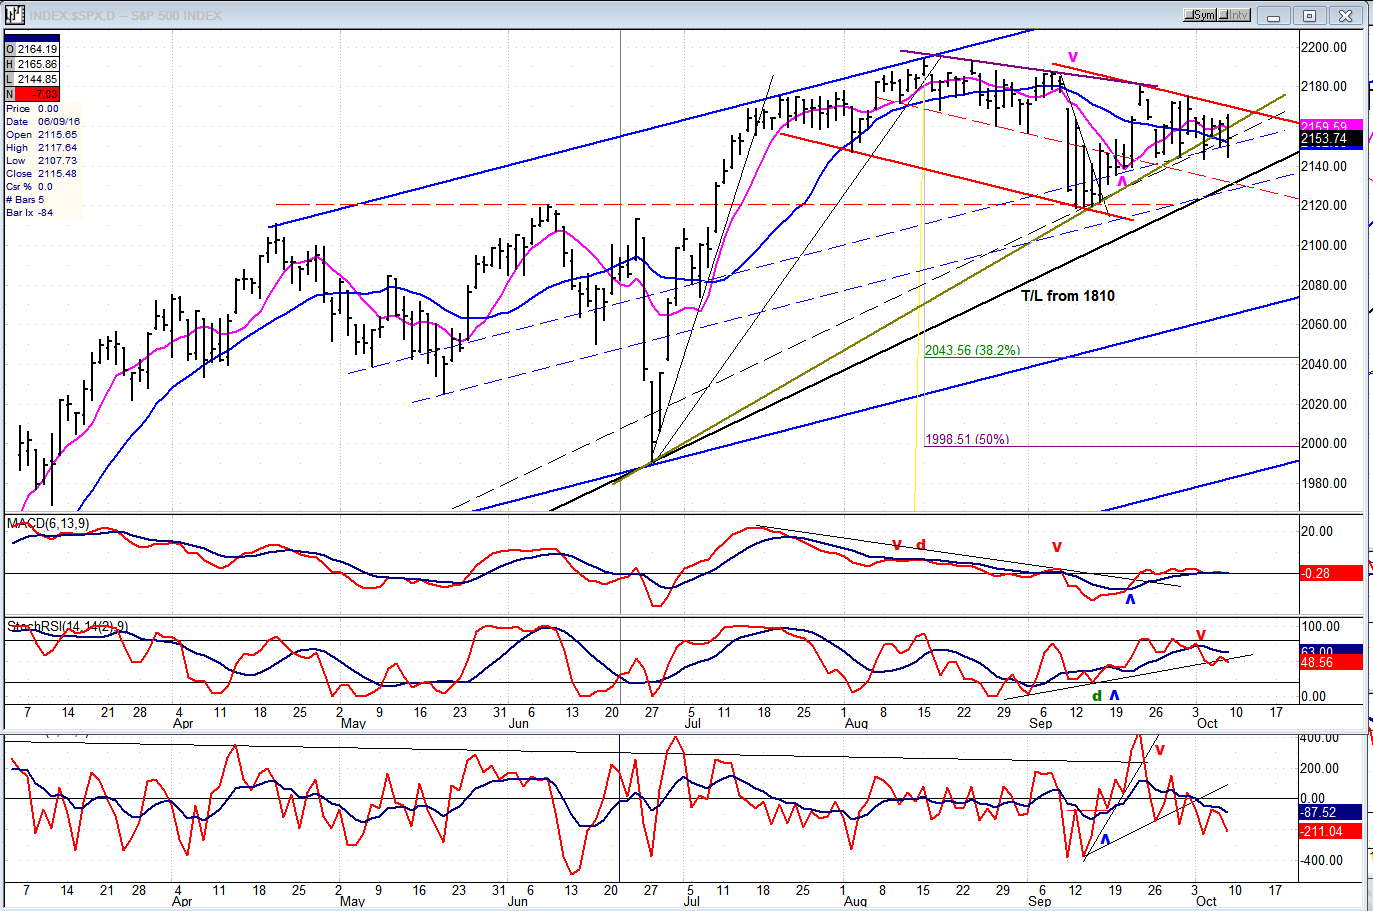
The consolidation pattern which started on August 15, started to roll over and eventually broke into a steep decline, but it only lasted for a couple of days, then formed a base and rallied to a slightly lesser high. Since then, another declining pattern has formed and on Friday, it closed outside of the greenish trend line from 1992.
Even if it were to break this trend line, it could find support on the longer trend line from 1810,or it could slice through it and make a new low. Should it do this, it would most likely stop on the blue parallel which is drawn across the 1992 low. But breaking that level to retrace .382 of its rise from 1810 would not be unreasonable.
There is another parallel drawn across the 1810 low which forms a much broader channel. A few weeks from now that lower channel line rises to about 2000, which corresponds to the level which would be a 50% retracement. Certainly, enough distribution has taken place over the past several weeks to carry prices down that far, but we may be running out of time to take advantage of the full count if we are to make a low in late November -- unless we have a precipitous decline a la August or December corrections.
A sign that we could be ready to imminently move lower is developing in the oscillators, with two of them already in a downtrend, and the MACD seemingly ready to join them. And let’s not forget that if we do break the trend line from 1810, we are talking about an eight-month trend line, not something minor. Certainly breaking a trend line of that magnitude should bring more than a few sellers out of the woodwork.
Hourly chart
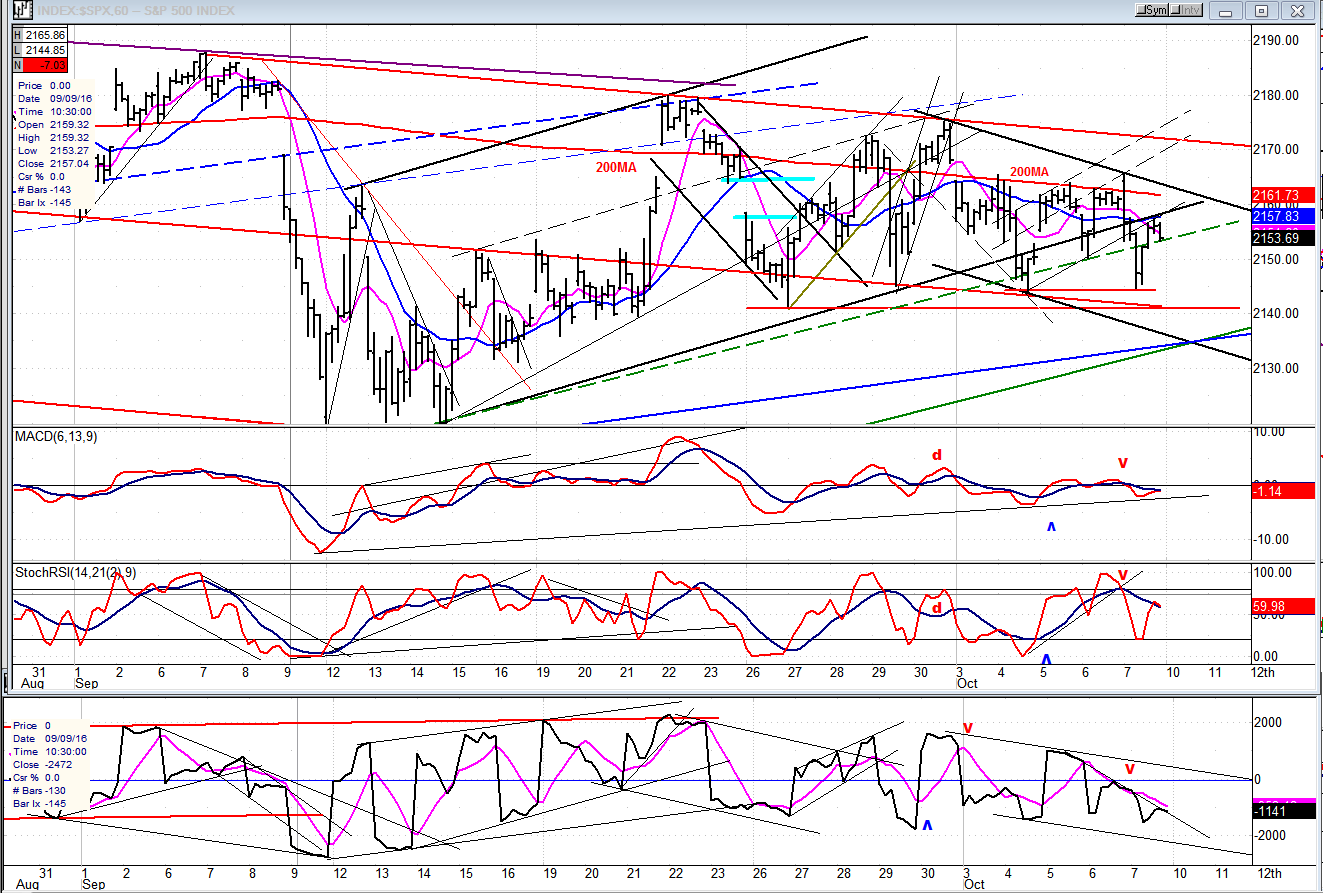
On the hourly chart, we can see that prices were being squeezed between the descending red trend line and the rising black trend line. In the past couple of days, the black trend line was penetrated, but support from the former short-term lows and from the trend line from 1810 kept prices from falling.
On Friday, it looked as if we were finally going to start the long-anticipated accelerated phase of the correction, but traders bought at the level of the previous lows and rallied prices to back-test the black trend line before pulling back slightly into the close.
If we start down on Monday, we could go on to challenge the green trend line from 1810, which should provide some temporary support since it is making a junction with the blue line and the lower black channel line. The move, however, could be substantial enough to eventually break through them all to go and test the 2120 low at a very minimum.
MACD has a series of declining tops which matches the price pattern and could go into a full decline when it breaks the rising trend line. The lower A/D oscillator demonstrates that increasing selling is already taking place.
Some leading & confirming indexes (Weekly charts)
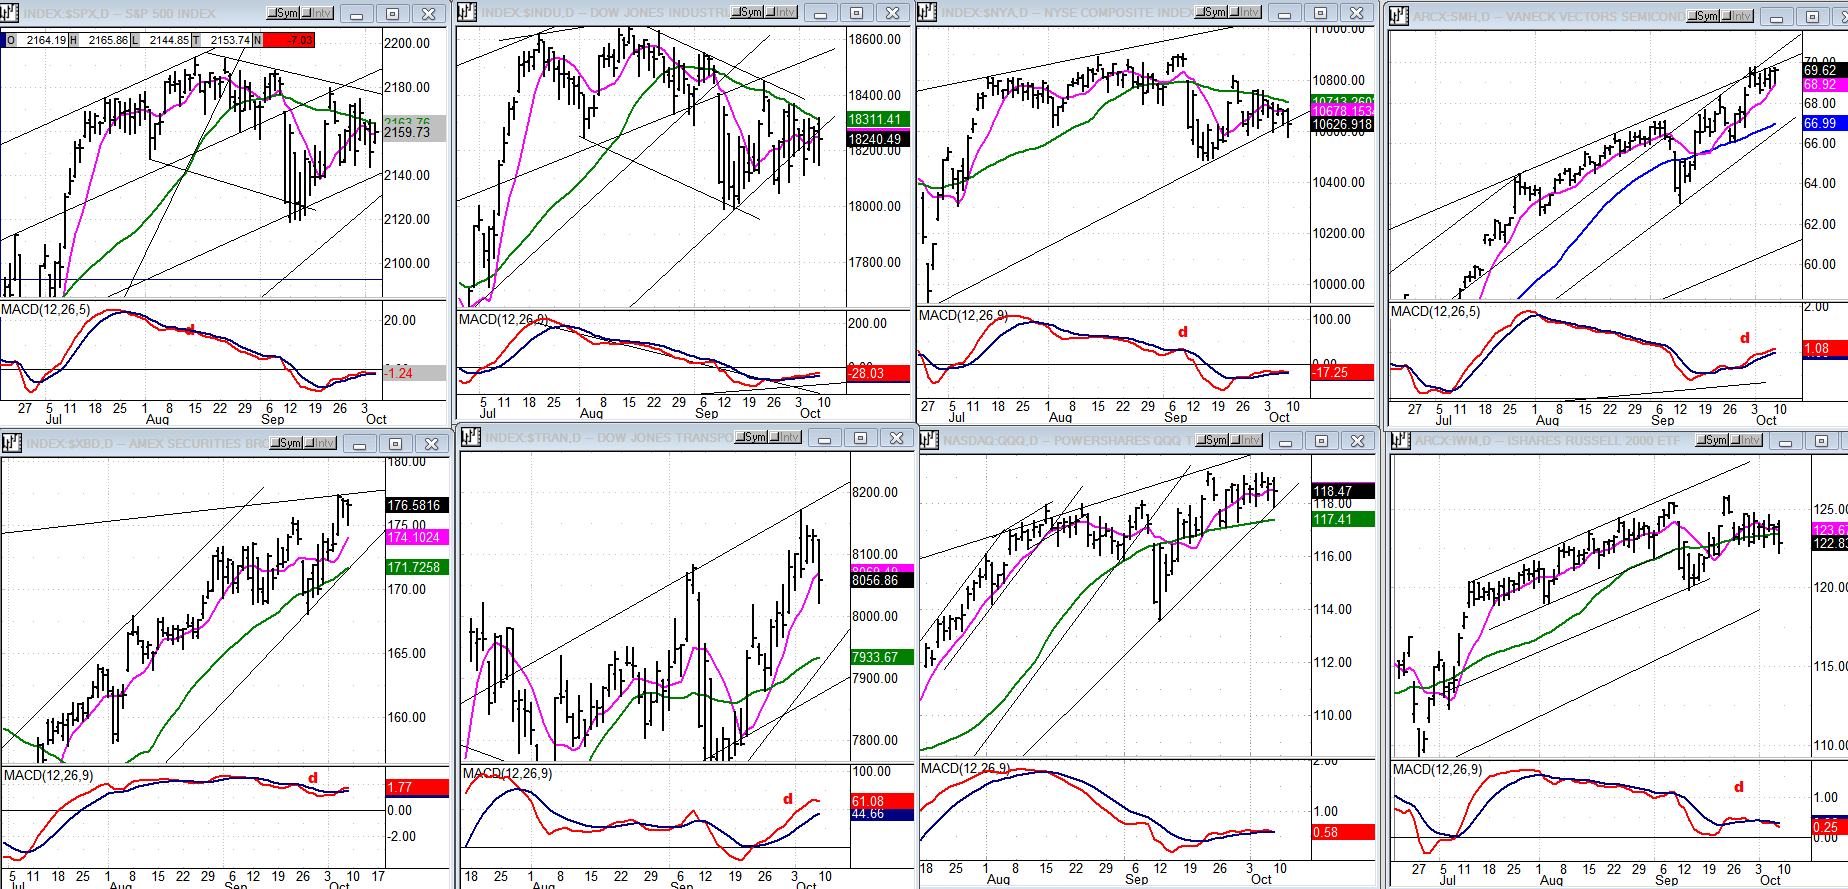
The three main indexes, SPX, DJIA and NYA (top left) are all showing signs of challenging their trend lines from early February, with DJIA and NYA being the most advanced. iShares Russell 2000 (NYSE:IWM) comes next with PowerShares QQQ Trust Series 1 (NASDAQ:QQQ) close behind in the process of forming distribution patterns.
But there is too little coordination of behavior among all the indices for the coming correction acceleration to be anything of major concern, even if it does continue into November. For some of these indices, it looks as if it will only be a moderate retracement.
PowerShares DB US Dollar Bullish (NYSE:UUP) (dollar ETF)
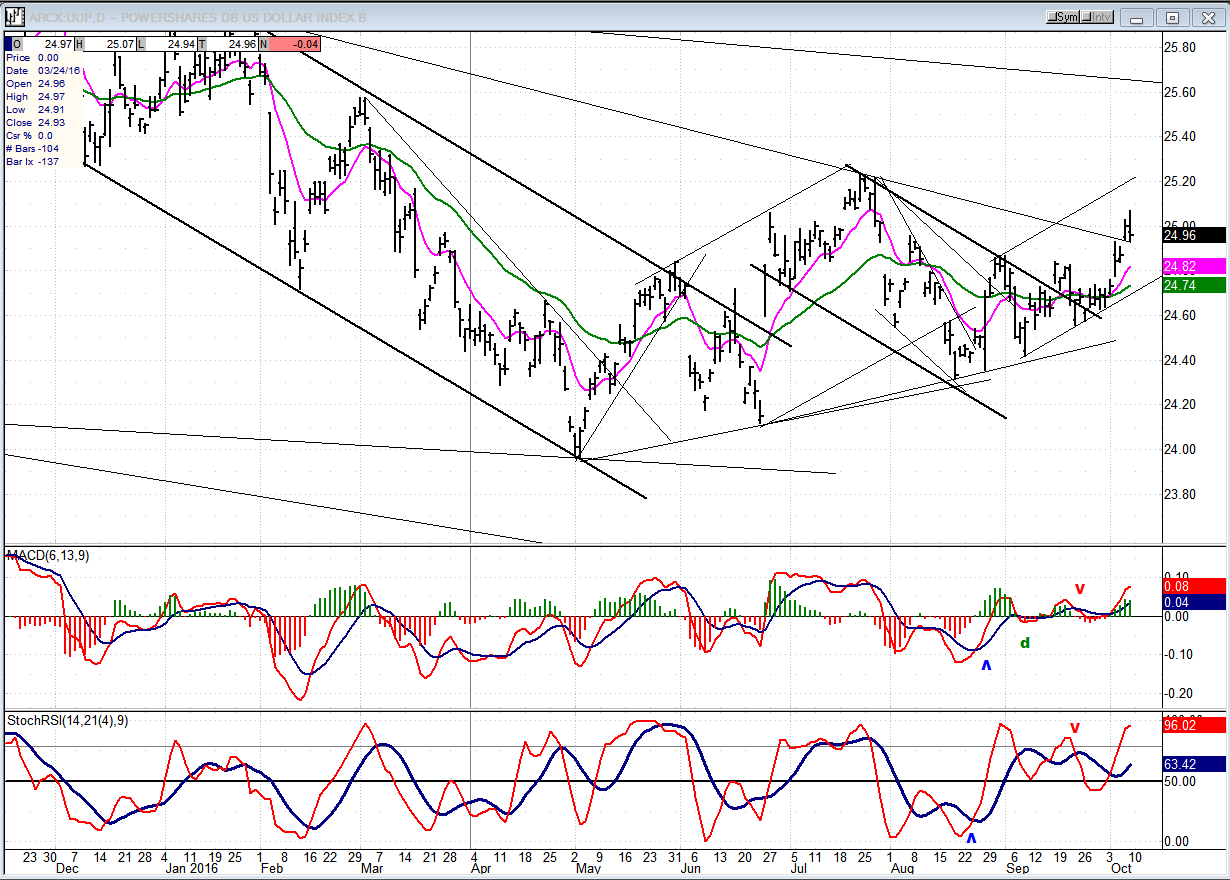
UUP has broken out of a trend line and risen above a former short-term resistance level, but it still does not look as if it is ready to challenge its top correction trend line. However, if it can rise above 25.30, this will become a more credible uptrend.
VanEck Vectors Gold Miners (NYSE:GDX)
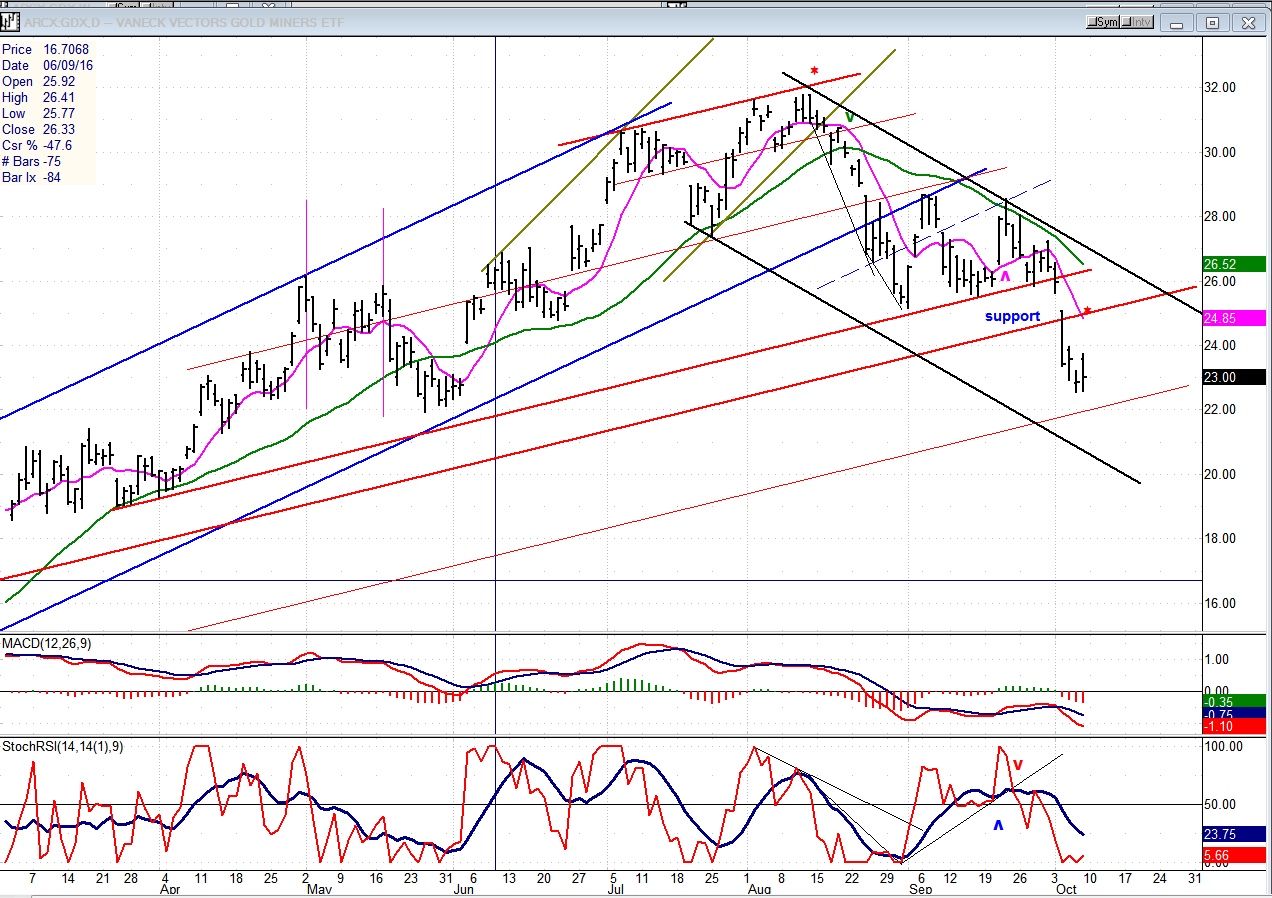
GDX showed its weakness by dropping to a new correction low last week. It should find some temporary support around 21.50-22, but this is not likely to be the end of the correction. Projections down to the 18 level may eventually be met.
United States Oil (NYSE:USO)
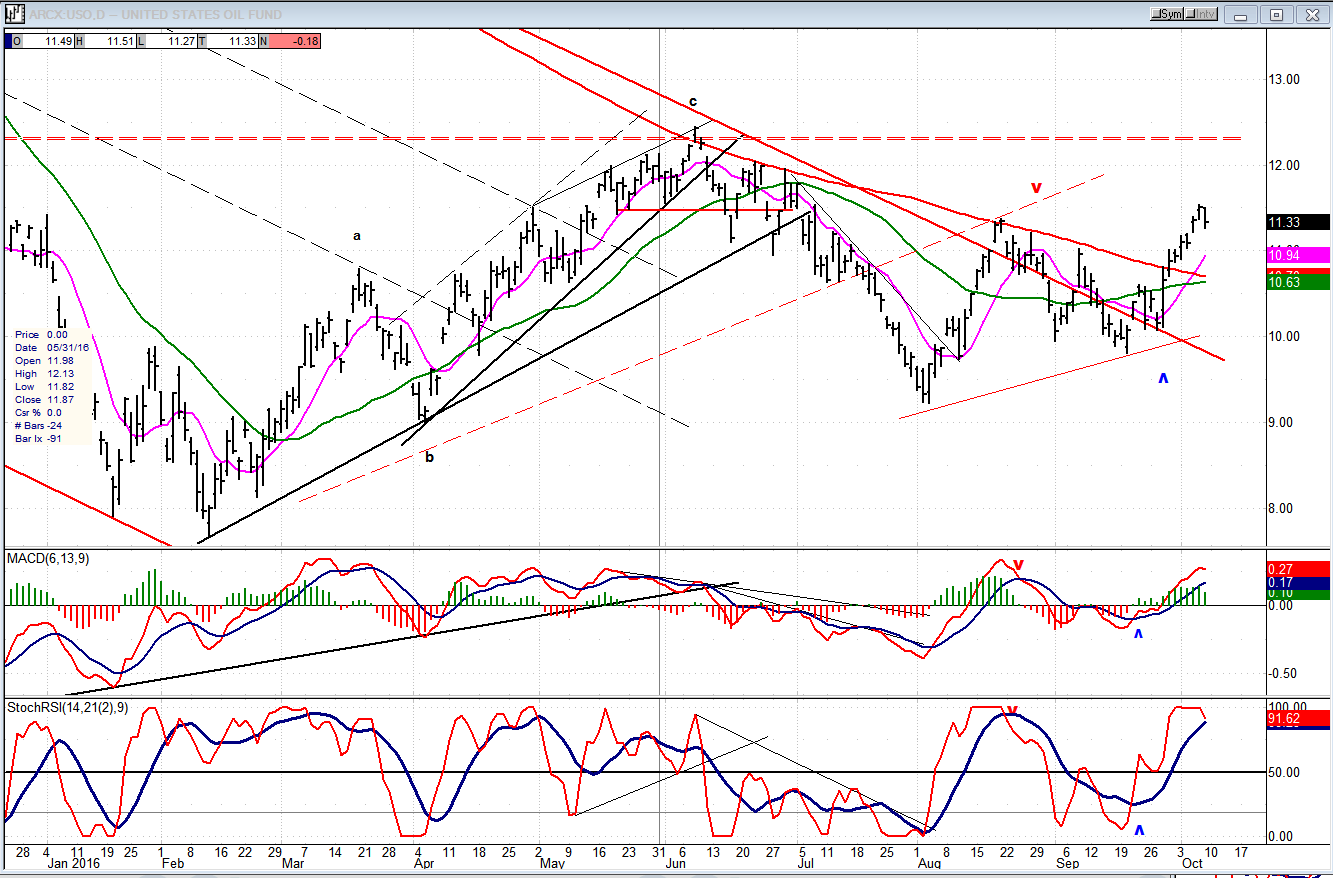
USO moved a little higher this week and has now reached a resistance level. I doubt if its current action will result in anything important until it establishes a base large enough to take it significantly beyond the dashed line, which was as far as the original rally from the low could go.
Summary
Topping and declining cycles are putting pressure on the major indexes, some of which are already seriously challenging an important trend line from the February low. If that trend line fails, sellers should appear and drive prices lower. How low, is the question! Even though a substantial period of distribution has taken place, the time factor may not allow for a full count to be achieved.
