Have you ever sat in a park or garden on a warm Summer’s day, not thinking of anything in particular, when a large bubble drifts into view, blown by an unseen child? You watch it with mild curiosity knowing that it is doomed – it will either be finished off by the “Black Swan” event of hitting the branch of a tree or it will simply come to the end of its natural life and pop spontaneously. If the latter, you may notice that if you watch it carefully it becomes attenuated (thin) and slightly blotchy looking for perhaps a few seconds before it pops. That is exactly what is happening with the current bubble in US stocks.
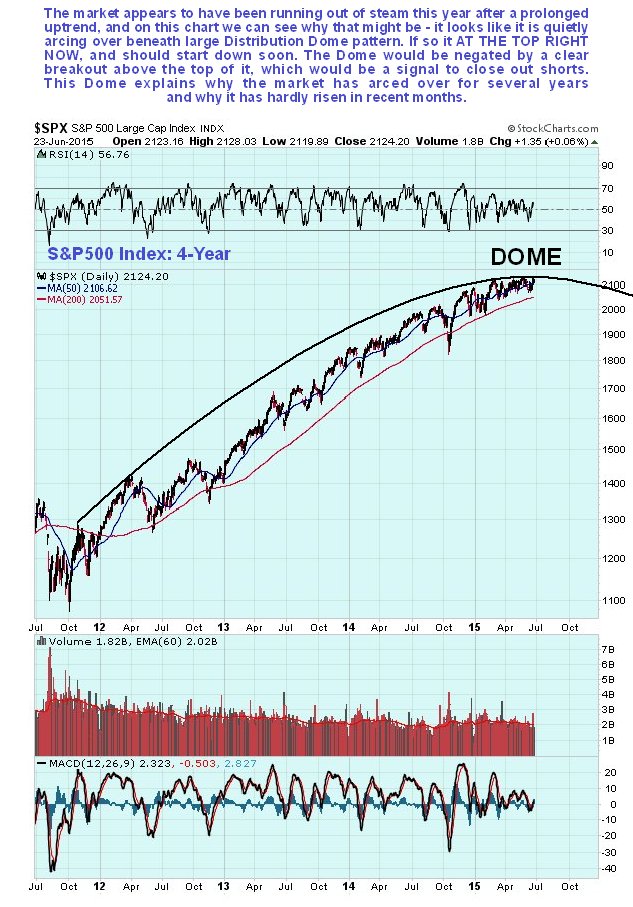
Look at the two charts for the S&P500 index below and you will see precisely what I mean. On the 1st 4-year chart we see that the index is rounding over beneath a Dome pattern, with the advance stalling out in recent months at the top of the Dome on lower volume and a marked decrease in volatility – this is viewed as the equivalent of the bubble becoming thin and blotchy before it pops.

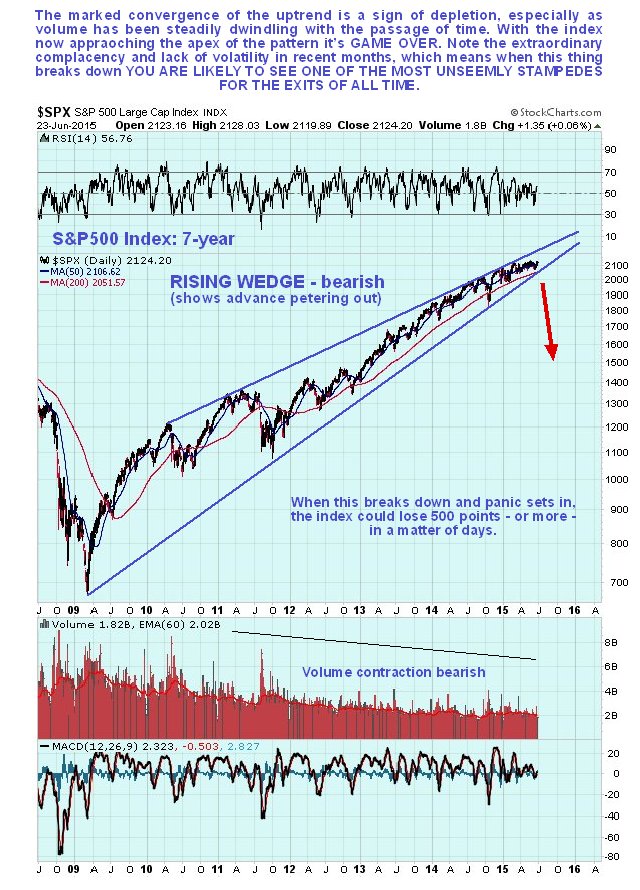
On the 2nd 7-year chart we see that the index is coming to the apex of a huge bearish Rising Wedge, which is bearish because it shows a steady diminution of upside vigor as the advance has progressed. The arrival at the apex – it could theoretically hold up a few months more – shows that the advance has come to the end of its natural life, and that it should tip into a bearmarket soon. We know that the Fed, which answers to its masters on Wall St, is not going to go poking this bubble with a stick and popping it prematurely, it is committed to leaving it to waft around at high levels until it pops of its own accord. This is why it has continued for so long, but its demise looks imminent. The abrupt change in sentiment that would be triggered by a breakdown from the Rising Wedge would likely result in a massive stampede for the exits that could easily drop the index 500 points – or more - in a matter of mere days.

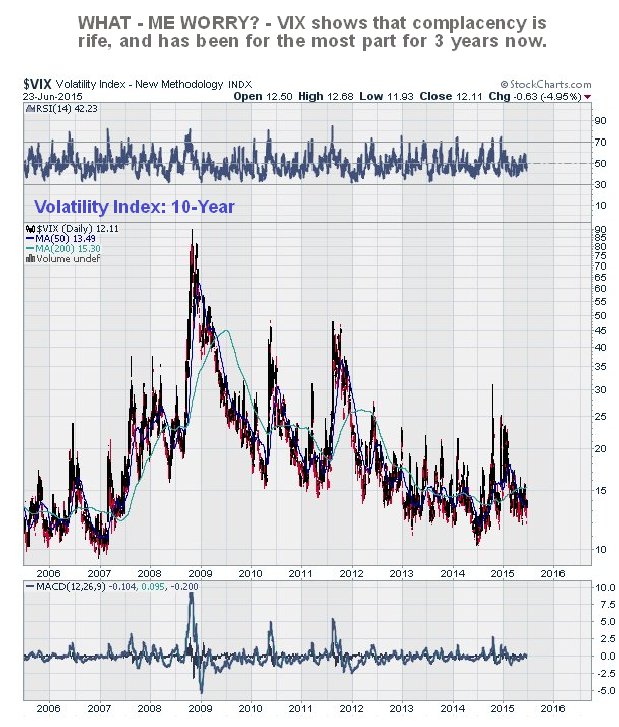
The extraordinary complacency of recent times is captured pictorially by the long-term chart for the VIX shown below, which has mostly remained at very low readings since early 2013...

With stocks having risen again in recent days on relief about Greece, it’s another good time to go for the broad market bear ETFs earlier featured on the site. Remember to employ a general stop above the Dome on the 4-year chart for the S&P500 index shown above, and if it does break above it, which could be a false move to trigger stops, to re-enter on a break back below the Dome boundary.
