Traders buy and sell assets everyday. For example, despite ridiculously high P/E ratios and a huge gain over the last 5 years, there are traders who continue to purchase Biotech stocks every single day. On the other hand value investors are different. Their main goal is to buy an asset on cheap, or as the old adage states “buy low, and sell high”. The problem value investors face is figuring out what cheap is, and when low is low enough to be the bottom (or at least close to it so the drawdown is limited).
If you are a value investor today, surely you would be looking to allocate at least a small portion of your portfolio towards the precious metals sector. Unlike the US stock market, which has tripled in value over the last 5 years, precious metals have been selling off lower since middle of 2011 and offer great value. The question most investors continue to ask is how low do the metals go, before that value starts showing up in the P&L?
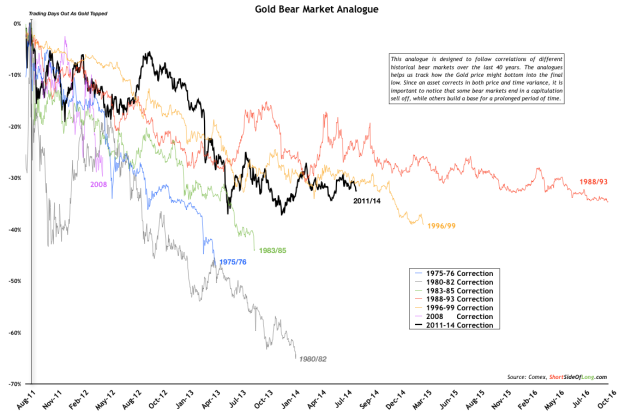
Chart 1: Gold bear market is turning three years old in early September
Source: Short Side of Long
There is no easy way to answer that question, but one way to try and estimate it is by looking at previous historical bear markets. Both Gold and Silver started its free market trading in early 1970s, so the data is obviously limited to just over four decades. During that time frame both Gold and Silver have suffered many pullbacks and corrections, but have only gone through 8 serious bear markets.
Since Silver is one of the most volatile assets on the planet, we do not use a simple 20% sell off rule for a bear market, and instead gauge it based on a more serious sell off and a prolonged downtrend of lower lows and lower highs. Finally, the observations made below are done with an assumption that the bear market will still produce one final lower low. If this does not end up being the case, both metals have already bottomed in middle of 2013.
Starting with Gold in Chart 1, we can make a few observations:
- Precious metals bears who claim that Gold was in a bubble in 2011 with similarities to 1980 are most likely mistaken. When real bubbles burst, they sell off rather rapidly by falling in similar fashion to the way they risen… with amazing losses. When the Gold bubble burst in 1980, the price sold of by 66% (two thirds) in the pace of 18 months. The recent sell off was only one third at its worst point… hardly a bursting of a bubble!
- The current bear market has so far been the third longest in time. The longest bear market for Gold started from the peak just before 1988 and lasted for 5 long years, all the way to the beginning of 1993. Assuming we follow a similar pattern, Gold would move sideways until October 2016. If this was to be the case, those who purchased Gold would not experience a large downside risk, however there capital would be trapped in a nonperforming asset. This is commonly known as a value trap.
- The closest correlation the current downtrend has with previous ones, is the 1996 to 1999 bear market drawn in yellow (refer to Chart 1). The initial sell off lasted about two years, at which point a long consolidation started. Both bulls and bears became frustrated at the lack of a trend, similar to what has been happening as of late. While the Gold bulls claimed that it was a basing pattern at the time, the price actually collapsed one last time into a final low before a bull market took off.
Chart 2: Silver has now been in a bear market for 3 years and 4 months!
 Now for some Silver observations, so please refer to Chart 2:
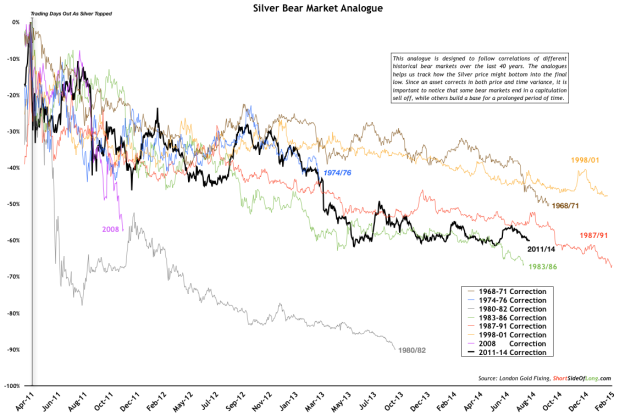
- Silver bear market is currently almost 3 years and 4 months old. By historical precedent, this is one of the longest bear markets since Silver started trading in late 1960s. We have just taken over the 1983-86 downtrend and in a month this bear market will also be longer then the 1968-71. In theory, if Silver does make a lower low, we are now only months away from setting a new record. Already we are given a hint that the downtrend is exhausted, so a lower low well into 2015 would be a true historical anomaly and most likely a terrific buying opportunity.
- Since Silver peaked around a similar price point in both 1980 and 2011, precious metal bears were once again predicting a 1980s style bust and total wipe out. After peaking at $50 in early 1980, Silver fell to $5 per ounce (90% decline) in a space of just over two years. However, as the analogue clearly shows, the current bear market isn’t anything like the 1980-82 bubble crash. It is actually correlating more with 1983-86 and 1987-91 downtrends in both time and price drawdowns.
- Each one of the final bottoms produced some kind of an extraordinary gain. After bottoming out in 1971, Silver shot up by more then 450%. As the 1974-76 downtrend ended, Silver managed an amazing performance of 1200% or 12-fold over the next 4 years. This was the end of a secular bull market. The huge bust in 1982 eventually saw the metal triple from the lows. The 1986 bottom saw gains of 100% within the following 12 months. The 1991 bottom was the most disappointing of all even though it was the lowest low, as Silver spent majority of the time moving sideways. Gains of 100% only showed up year years later in 1998, as Buffett was reportedly buying the metal. Silver’s bottomed in 2001 produced gains of over 500% in coming years, while the Global Financial Crisis bottom of 2008 produced another 550% plus rally in less then three years. Even without counting the speculator gain in late 1970s, Silver averaged around 350% gain after every bear market. As we can see, buying Silver at the bottom is incredibly difficult task, but has amazingly lucrative gains for those who have the skill and luck to execute it.
Guessing isn’t very useful when it comes to investing, but if I had to make a guess I would say that both metals sell off one final time into a lower low by early 2015. Based on historical analogues alone, Gold seems to be following the 1996-99 bear market quite well and could bottom around March 2015. At the same time if Silver falls to a lower low around March 2015, that would be one of the longest and most oversold downtrends (not including the 1980-82 bubble crash).

