Market Brief
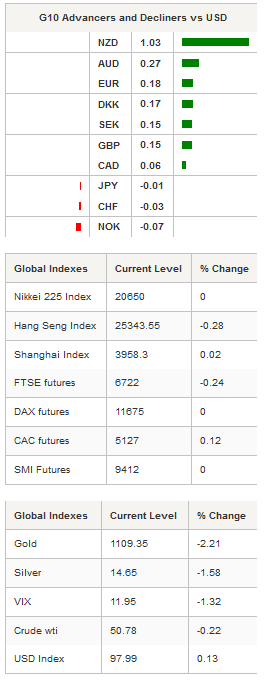
Gold dropped as much as 4% to reach $1,086.18 per ounce, the lowest level since November 2010, as China reported that it holds 1,658 metric tons of gold, which is much less than expected. Gold is now consolidating above $1,100. The Australian dollar, which is very sensitive to commodity prices, dropped 0.48% against the greenback before stabilising around 0.7360, as gold miners got slammed from the drop in prices, with Evolution Mining (ASX:EVN) down 14%, Newcrest Mining (ASX:NCM) down 10%, and Northern Star Resources (ASX:NST) down 9.60%. However, Australian shares are edging higher this morning and gained 0.23% against this backdrop. Silver is down -0.50%, palladium falls -1.10%, while platinum drops 1.70%
In Asia, equity returns are mixed this morning, with the Shanghai Composite up 0.02%, the Shenzhen Composite up 0.57%, while South Korea’s Kospi retreats -0.17%. In Japan, market is closed for Sea Day, public holiday. USD/JPY is trading in thin liquidity conditions and is edging slightly higher to 124.15.

In Greece, banks are expected to reopen this morning after a 3-week closure. The €60 daily withdrawal limit will be replaced by a €420 weekly limit. However, Greek businesses will remain under pressure as international transfers are still banned. Markets are still worried about the Greek deal, as Germany is not ready to offer a classic haircut, and will rather negotiate the terms of the debt. EUR/USD is testing a key support at 1.0819, and is currently trading slightly above at 1.0830. Last Friday’s US CPI report was in line with expectations, with June headline CPI at 0.1%y/y or 0.3%m/m, while Core CPI printed at 1.8%y/y or 0.2%m/m. On the housing front, June Housing Starts printed at 1,174k versus 1,106k consensus, while Building Permits jumped to 1,343k versus 1,150k median forecast. On the other hand, University of Michigan July preliminary sentiment index fell more than anticipated to 93.3 versus 96.0 median forecast and 96.1 previous reading.
In UK, the cable is trading range-bound between 1.5670 and 1.5550, as it failed several time at breaking the strong 1.5640/70 support area (Fib 38.2% on June rally). GBP/USD just broke several strong resistances, such as the 200dma on July 10, the 38.2% long-term Fibonacci level (on July 2014 - October 2105 debasement) and the 50dma, both on July 14. This is, therefore, a strong bullish signal from the technical side, while on the fundamental one, traders are starting to price in a rate hike from the BoE. The July 9 MPC minutes will provide further clarity on the timing of the beginning of the tightening cycle. The Footsie is down -0.24%.
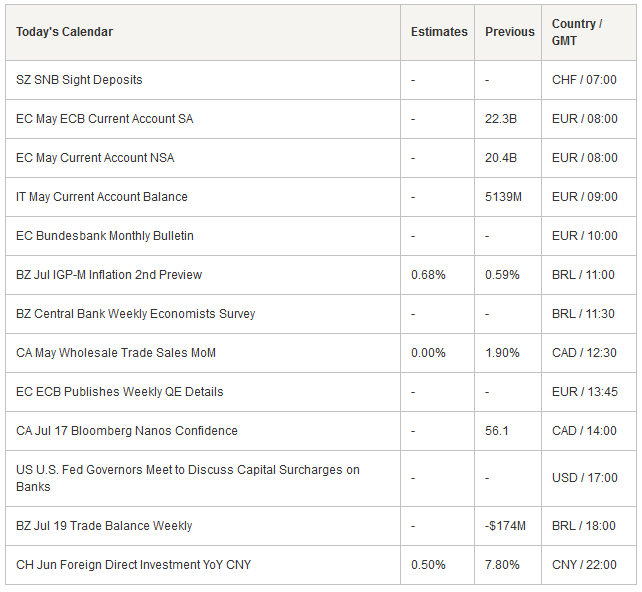
The economic calendar is pretty light today, with ECB current account for May, May wholesale trade sales from Canada and weekly Trade Balance from Brazil.

Currency Tech
EUR/USD
R 2: 1.1436
R 1: 1.1278
CURRENT: 1.0854
S 1: 1.0819
S 2: 1.0660
GBP/USD
R 2: 1.5930
R 1: 1.5803
CURRENT: 1.5620
S 1: 1.5330
S 2: 1.5171
USD/JPY
R 2: 125.86
R 1: 124.45
CURRENT: 124.10
S 1: 120.41
S 2: 118.89
USD/CHF
R 2: 1.0129
R 1: 0.9719
CURRENT: 0.9614
S 1: 0.9151
S 2: 0.9072
