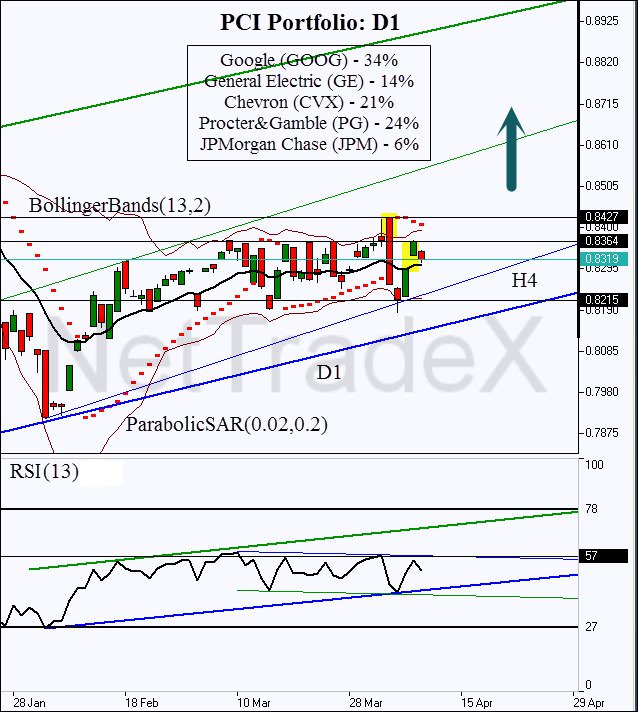
Today we analyze the investment performance and perspectives for the portfolio created by GeWorko PCI method. The portfolio components are selected from the golden list of Top-10 S&P 500. Optimization of weights for the period 26.06.2013-14.03.2014 was conducted according to the capital asset pricing model (CAPM). The portfolio showed 1.6% yield with a maximum volatility (drawdown) at 2.9% within 9-month historical period. Thus, the ratio of return/volatility was 55%. This figure rose to 71% since the moment of weight optimization and portfolio compilation and that confirms the optimization effectivity. The yeald for the period from 14.03.2014 to 11.04.2014 was 7.7%, with volatility of 10.8%. Thus, the retrospective portfolio optimization allowed to improve its attractiveness for investors.
Here we consider the portfolio daily chart in the NetTradeX trading platform. At the moment, the market situation creates good points for long position opening, as it follows from the figure.
The price keeps drifting within the H4 upward channel. The D1 macro trend is also rising, existing since 26.06.2013, for almost 10 months. It is a particular indicator of the U.S. economic recovery after the recession of 2008. Note that unemployment and GDP have returned to the pre-crisis levels, and continue to improve their performance. At present, the price tested the upper boundary of the Bollinger Bands (13,2) channel and showed a bullish gap right away. This is the first signal of potential portfolio growth continuation after the market energy is accumulated. The RSI (13) also confirms the price movement direction. We would expect its preliminary resistance breakthrough at 57. Afterwards, a strong movement impulse is most probable.
It is recommended to place a pending order above the resistance level at 0.8364. After crossing this level, we should expect the ParabolicSAR bullish reversal. The preliminary target is to be slightly below the 161.8% Fibonacci system, at the last historical peak within this area - 0.8427. This level is also supported by historical values of the ParabolicSAR. Note that the quotes of the High/Low PCI instruments are model, in other words they are approximate due to the download history duration. Therefore, we use and recommend you to use Close/Open prices (boundaries of candle bodies) to determine the support and resistance levels.
