While we wait for the FOMC decision, I thought it would be an interesting learning experience to present a recent trade I’ve been a part of. The most interesting part about it is not the success or failure, but how it all played out in real time and surprised so many investors (including myself).
In the future I will do more of these posts, regardless of whether they are winners or losers, which might help some of you with your own trading. I know that putting pen to paper (or in this case fingers on the keyboard) and reviewing my recent decisions and actions definitely helps me.
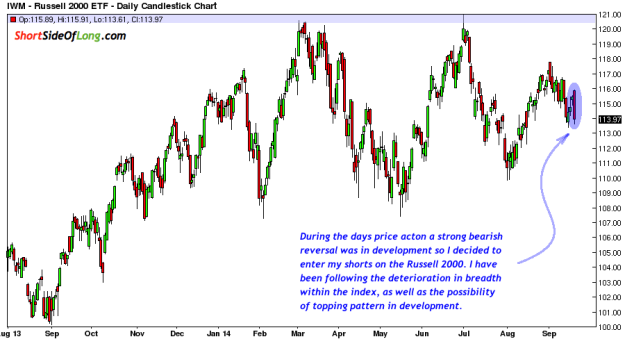
Chart 1: Opened the short against US small caps on 19th of September

I cannot possibly cover everything that comes to mind when I'm executing trades, so I will keep it as brief as possible. On Friday the 19th of September, I was away on a trip and happened to be in Seoul, South Korea. Even though there are quite a lot of distractions there, I was keeping a close eye on the global equity markets, hold neither longs or shorts. I wanted to short the small caps index for a while, due to its high valuation reading and deteriorating breadth participation (amongst other signals).
As I looked at the September edition of Merrill Lynch’s Fund Manager Survey, I noticed that funds held a very high exposure to equities. At the same time we were approaching end of QE and volatility could pick up.
I also noticed the huge divergence between large and small caps like the S&P 500, which at the day of my entry was at record highs. Furthermore, global breadth was thinning, as the actual correction started in June with Europe leading the way to the downside. Furthermore credit spreads and volatility was starting to rise, indicating some sort of financial stress in the system.
I opened my short on the Russell 2000 via the iShares Russell 2000 Index (ARCA:IWM) ETF at $114.55 with a very tight stop loss above the reversal candle at $116. I was prepared to risk about 1.2% on the small cap index and since the stop loss was very tight, to make the trade more powerful, I decide to use a lot of leverage (20 to 1). A loss would only cost me a couple of hundred basis point of my fund’s NAV, while a win could be a very handsome reward indeed.
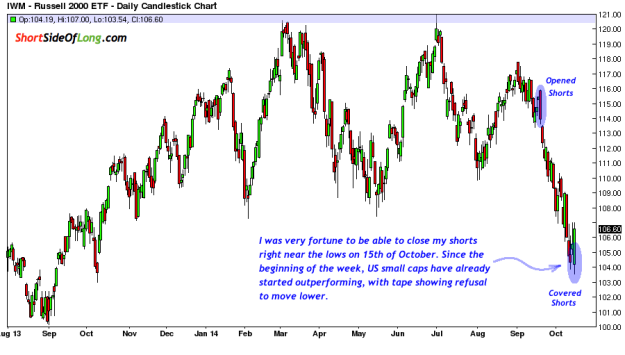
Chart 2: Didn’t expect Russell to go straight down for next few weeks…

Once the trade is open, no one ever really know swhat comes next (regardless of how smart some of us sound). That is why a review of recent price events, as well as my own thought process, is an interesting read in hindsight.
For weeks following the short position, the Russell 2000 kept declining and under-performing larger cap stocks. The sell-off started to intensify during the early parts of October and various media outlets were puzzled as to why stocks were falling. I was in Singapore at the time and talking about my short position to a friend, who I regard as mentor. I was saying how media is blaming it on the Eurozone, some blamed it on Ebola and others said that ISIS (all the way in Iraq) is behind the declines.
At this point, the Russell 2000 already declined by about 10%, so media coverage started to focus on how small cap stocks were already in correction mode, giving it plenty of negative attention. As the ETF broke below $108, many technical analysts stated that the neckline of a “head & shoulders pattern” was triggered and that Russell 2000 could fall by at least another 10 to 15 percent… if not totally crash!
On Monday the 13th of October I noticed that something started to change. US small caps started outperforming their larger cap counterparts, with the tape refusing to move lower. As the VIX dramatically spiked on Wednesday the 15th (usually a signal of capitulation), Russell 2000 barley budged lower. Then we saw Treasury Bond prices spike higher in panic buying as majority of bond bears realised that rate rises might not come as early as hoped for. I decided to cover all my shorts and close my yen long (safe haven play opposite to stocks).
I remember at the time talking to another friend in Singapore and telling him that my instinct and gut feeling is telling me at least a short term inflection point is at hand. Because I was heavily leveraged and the trade was a huge success making a mini fortune most people don’t earn in years, I decided to walk away at that exact moment.
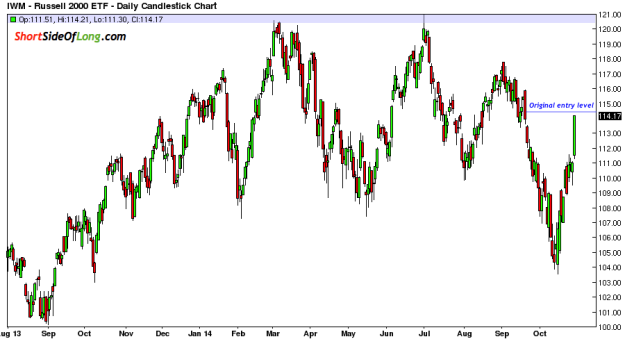
Chart 3: …or to rebound crazy straight back up in a few weeks after that

Various bloggers I follow were certain that we were about to enter a waterfall decline, also known as a crash. They stated various indicators and analogues, dating all the way back to 1929. At the same time, extremely popular and ever so famous investing guru – Dennis Gartman – was on CNBC letting everyone know he was 100% cash and T-bills because a “huge bear market is coming and would last for months.” Little did we all know what would happen next.
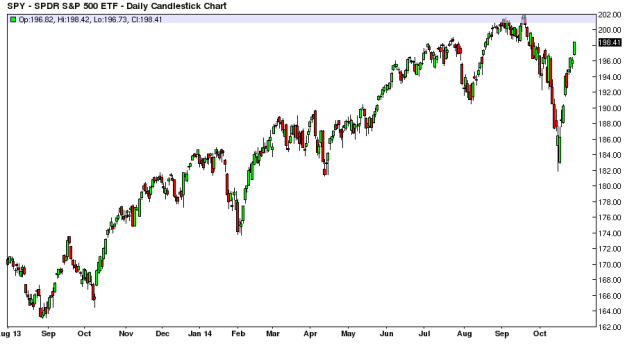
The rebound in US equities has been quite amazing, as prices have now literally returned to the point from which they originally fell (especially seen in Chart 4 with S&P 500). It turns out that, if I held onto my shorts, as of last night I would pretty much be at a break even level. I would assume many bulls have been shaken out of their long positions, while many bears were sucked into believing that a downtrend is starting right before the short squeeze. Both sides are now scratching their heads…
After all, the job of the market is to steal as much money as possible, from as many participants as possible, in as many occasions as possible. And please do not think because I made a correct decision this time around (on the short term basis), that I am extremely smart or something. Personally, I have been humbled by the market on many, many, many occasions and I’m sure I’m awaiting my next punishment just around the corner!
Chart 4: US stocks have been a huge surprise for both the bulls & bears

So I leave you with this great quote: a wise trader once said that the stock market is a man’s invention that has humbled him the most. If you are not humbled, you haven’t been around for long enough or you are just delusional.
