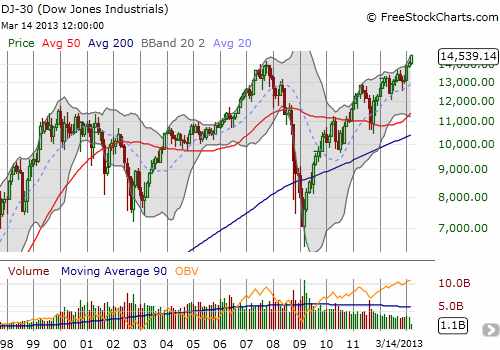
I do not pay much attention to the Dow Jones Industrial Average (DIA) and greatly prefer the S&P 500 (SPY) as being more representative of the stock market. However, anyone with a pulse has likely heard or read the breathless headlines about the Dow’s all-time highs.
The Dow is now up ten days in a row, a feat not seen since 1996. Yet, as Art Cashin remarked on CNBC, this is a rally without joy or enthusiasm. Bears may call this catatonic state complacency; contrarians may delight in this mood as it could demonstrate the market is far from the euphoria that usually marks tops. What I have noted is that not even stocks are participating in this euphoria in a broad sense.
First of all, of the 30 stocks in the Dow, only 10 are hitting all-time highs along with the index. Those stocks are 3M Company (MMM), American Express (AXP), Chevron Corporation (CVX), Home Depot (HD) {marginally}, International Business Machines (IBM), Johnson & Johnson (JNJ), Procter and Gamble (PG), Travelers Companies (TRV), United Technologies (UTX), and Walt Disney Company (DIS). Caterpillar (CAT) gets special mention because it made new all-time highs in 2011 but has since sold off over 25%. The divide between these star performers and the rest of the pack is relatively wide. Stocks like Aloca (AA), AT&T (T), Bank of America (BAC), Cisco (CSCO), General Electric (GE), Hewlett Packard (HPQ), Intel (INTC), Merk (MRK), Microsoft (MSFT), and Verizon (VZ) are nowhere near their all-time highs, constituting another 1/3 of the index.
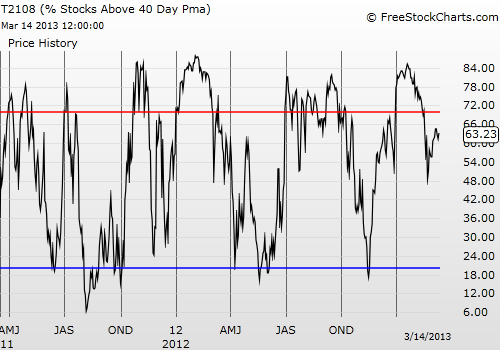
This dichotomy can be seen in the general market. An indicator I like to follow is the percentage of stocks trading above their 40-day moving averages (DMA). In FreeStockCharts.com, it is called T2108. I follow this index closely in my T2108 Updates. Currently, T2108 is at 63%. This means that almost 40% of stocks are trading below their 40DMAs. These are all stocks nowhere near their all-time highs. Typically, during a strong rally like the current one, T2108 moves into “overbought” territory which is 70% or higher. With the S&P 500 a mere few points away from its all-time high, I would have expected T2108 to be closing in on 80% or more. Instead, it seems a good number of stocks are getting left behind. 
T2108 is showing a lack of enthusiasm (red line marks overbought, blue line marks oversold)
Note that when the stock market exploded higher to start the new year, T2108 went as high as 85%. The 20 percentage point differential between then and now, represents a large number of stocks whose performance has sharply diverged from that of the S&P 500 (or stock market in general). This setup provides a very good reason to hold the enthusiasm or joy: the lofty heights are not getting broadly shared.
Currently, T2108 has bounced between 60 to 65% since March 5th. The S&P 500 is up a mere 1.3% since then. Without more participation, the S&P 500′s rally should continue to lack luster. I will be looking to see whether T2108 can break out and finally join the S&P 500 in its upward climb. Until then, I will continue to assume that the rally is at high risk of an imminent correction.
Be careful out there!
Full disclosure: long CAT
Below you may find the video.
- English (UK)
- English (India)
- English (Canada)
- English (Australia)
- English (South Africa)
- English (Philippines)
- English (Nigeria)
- Deutsch
- Español (España)
- Español (México)
- Français
- Italiano
- Nederlands
- Português (Portugal)
- Polski
- Português (Brasil)
- Русский
- Türkçe
- العربية
- Ελληνικά
- Svenska
- Suomi
- עברית
- 日本語
- 한국어
- 简体中文
- 繁體中文
- Bahasa Indonesia
- Bahasa Melayu
- ไทย
- Tiếng Việt
- हिंदी
Poor Participation In The Market’s All-Time Highs Drives Caution
Published 03/15/2013, 06:23 AM
Updated 07/09/2023, 06:31 AM
Poor Participation In The Market’s All-Time Highs Drives Caution
Latest comments
Install Our App
Risk Disclosure: Trading in financial instruments and/or cryptocurrencies involves high risks including the risk of losing some, or all, of your investment amount, and may not be suitable for all investors. Prices of cryptocurrencies are extremely volatile and may be affected by external factors such as financial, regulatory or political events. Trading on margin increases the financial risks.
Before deciding to trade in financial instrument or cryptocurrencies you should be fully informed of the risks and costs associated with trading the financial markets, carefully consider your investment objectives, level of experience, and risk appetite, and seek professional advice where needed.
Fusion Media would like to remind you that the data contained in this website is not necessarily real-time nor accurate. The data and prices on the website are not necessarily provided by any market or exchange, but may be provided by market makers, and so prices may not be accurate and may differ from the actual price at any given market, meaning prices are indicative and not appropriate for trading purposes. Fusion Media and any provider of the data contained in this website will not accept liability for any loss or damage as a result of your trading, or your reliance on the information contained within this website.
It is prohibited to use, store, reproduce, display, modify, transmit or distribute the data contained in this website without the explicit prior written permission of Fusion Media and/or the data provider. All intellectual property rights are reserved by the providers and/or the exchange providing the data contained in this website.
Fusion Media may be compensated by the advertisers that appear on the website, based on your interaction with the advertisements or advertisers.
© 2007-2024 - Fusion Media Limited. All Rights Reserved.
