Politics to trump economics
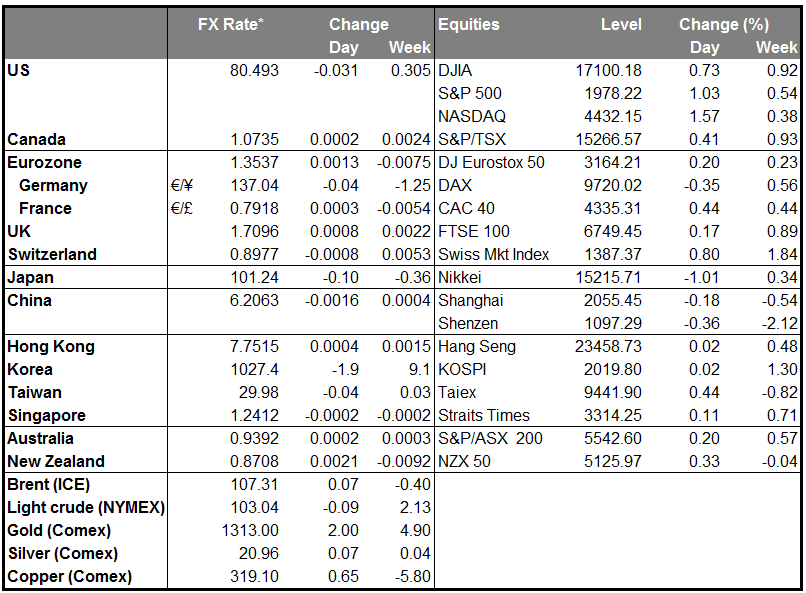
While of course the markets will be watching the economic indicators as usual this week, the focus of attention will be on the crisis in Ukraine. Until recently the markets have been rather sanguine about the whole affair, assuming the Russian occupation of Crimea would be a largely one-off event. Now, however the problems in Ukraine are forcing themselves upon the rest of the world and could become a more important, even defining, factor for the markets if the conflict continues to escalate. We need only look at the action last Thursday – USD up, JPY up, Treasuries and Bunds up, Gold and Oil up, and stocks and industrial metals down – to see what the impact on markets might be. We may be back to a “risk off” world, after all.
The crisis in Ukraine matters for the European economy at the margin. According to Berenberg Securities, German goods exports to Russia last year amounted to 1.3% of German GDP; exports to Ukraine added a further 0.2% to that. These exports are now collapsing; German exports to Russia fell 17% yoy in April, while exports to much smaller Ukraine plunged 43%. As the conflict has escalated since then, the data for the coming months is likely to be even worse. Fortunately, Germany is the strongest economy in the Eurozone, and most other Eurozone countries are less exposed than Germany, so this is probably not enough by itself to tip the fragile Eurozone recovery back into recession, but it certainly doesn’t help.
The toll on the Russian economy is likely to be much greater, however. Britain, Germany and France Sunday agreed they should be ready to announce a fresh round of sanctions at Tuesday’s meeting of the EU Foreign Affairs Council. As domestic uncertainty and capital flight add to the burden of sanctions and the costs of war, Russia’s already troubled economy could suffer a major blow. RUB and the Russian stock market are likely to be the major market losers.
Today: Monday’s calendar is relatively light. During the European day, Germany’s PPI rate is forecast to have declined 0.7% yoy in June, compared to -0.8% yoy in May. We also get Italy’s industrial orders for May. Neither release is a major market mover.
The only indicator from the US is the Chicago Fed national activity index, but no forecast is available.
There are no speakers scheduled Monday
This week: The highlight of the week will be The Reserve Bank of New Zealand’s policy meeting on Thursday. We expect the Bank to increase its official cash rate by another 25bps to 3.50%. While the rate hike is widely expected, recent weaker than expected inflation data and the further decline of dairy prices may take some pressure off the RBNZ to raise rates in the following months. That’s what the focus of attention will be on. Governor Wheeler will hold a news conference following the Bank’s rate decision. On Wednesday the Bank of England releases the minutes of its latest policy meeting. Recent comments and speeches by MPC members, plus the minutes of recent meetings, indicate that at least some members have moved closer to a dissenting vote, but I doubt that it will come this month. With no outright dissent, the focus will be on the range of views on space capacity among MPC members and the debate about when to start raising rates.
Rest of the week: On Tuesday, the US CPI for June is anticipated to remain unchanged in pace at +2.1% yoy. Given that US average weekly wages rose by 2.0% yoy in June, this would make a second month in a row that real wages declined. Fed Chair Yellen has emphasized that wage rises below the rate of inflation hold risks to consumer spending. Existing home sales for June is also coming out Tuesday and the forecast is for the figure to rise, but last Thursday’s disappointing housing sector data may push the figure to a weaker level. In Australia, the nation’s Q2 CPI is forecast to have slowed +0.5% qoq, from +0.6% qoq. From Canada we get retail sales for May, and from Eurozone, the preliminary consumer confidence indicator for July. Thursday: Besides the RBNZ policy meeting, Thursday is PMI day. We have China’s preliminary HSBC manufacturing PMI for July as well as Japan’s preliminary manufacturing PMI for the same month along with the nation’s trade balance for June. During the European day we get Eurozone’s preliminary PMIs for July, just after the two largest countries of the bloc, Germany and France, release their figures for the same month. Later in the day, the US preliminary Markit manufacturing PMI will take center stage. There have been signs that the global economy is slowing; these PMIs will help to confirm or correct that impression. Finally on Friday, we get Japanese CPI, the German Ifo survey for July and the UK’s first estimate of GDP for Q2. From the US durable goods orders for June are coming out.
The Market
EUR/USD hits 1.3500 and rebounds
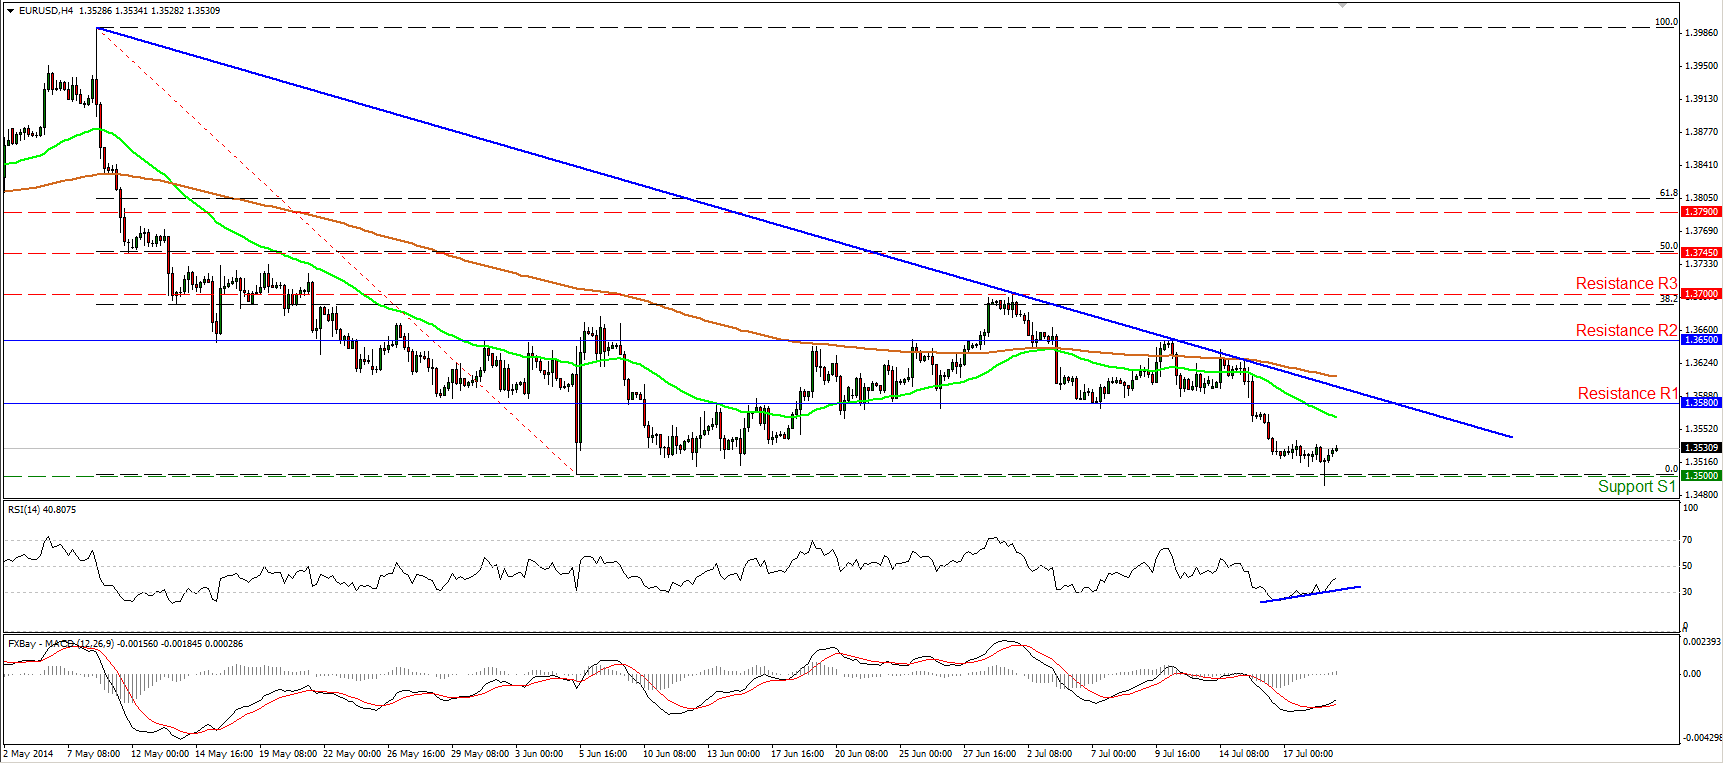
The EUR/USD declined somewhat on Friday to hit the 1.3500 (S1) barrier. The rate found some buy orders below that psychological barrier and rebounded slightly to trade near 1.3530. Bearing in mind that we can identify positive divergence between the RSI and the price action, and that the MACD moved above its signal line and is now pointing up, I would expect the rebound to continue, maybe to challenge the 1.3580 (R2) as a resistance this time. On the daily chart, I see a possible hammer candle, amplifying the case for the continuation of the upside corrective wave. Nevertheless, I would keep a neutral stance as far as the overall trend of the pair is concerned. The rate is trading below the blue downtrend line, but we need to see if the sellers are strong enough to overcome the 1.3500-1.3475 zone before expecting larger bearish extensions in the future.
• Support: 1.3500 (S1), 1.3475 (S2), 1.3400 (S3).
• Resistance: 1.3580 (R1), 1.3650 (R2), 1.3700 (R3).
EUR/JPY hits the 136.75 support
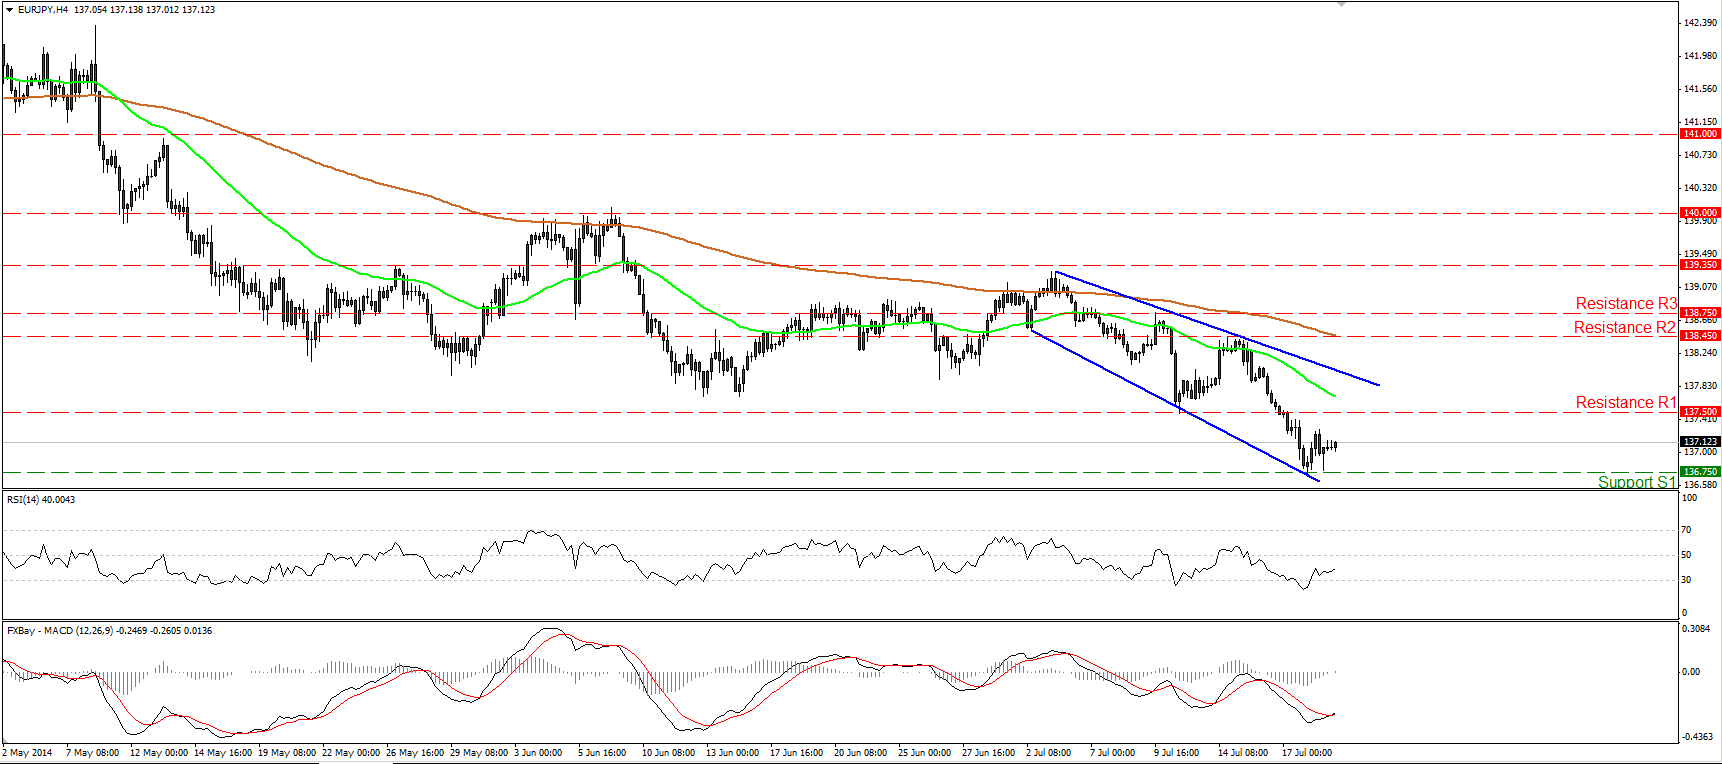
The EUR/JPY declined significantly, breaking below the 137.50 zone (support turned into resistance) and met our next barrier at 136.75 (S1). This move confirms a lower low and keeps the short-term picture negative. Considering that the RSI moved somewhat higher after exiting overbought conditions and that the MACD, although in its negative territory crossed above its trigger line, I would expect the forthcoming wave to be to the upside. However, as long as the rate is trading below the blue downtrend line and below both the moving averages, the short-term trend remains to the downside and I would see any possible advances as retracements for now.
• Support: 136.75 (S1), 136.20 (S2), 135.00 (S3).
• Resistance: 137.50 (R1), 138.45 (R2), 138.75 (R3).
Is GBP/USD ready to retrace?
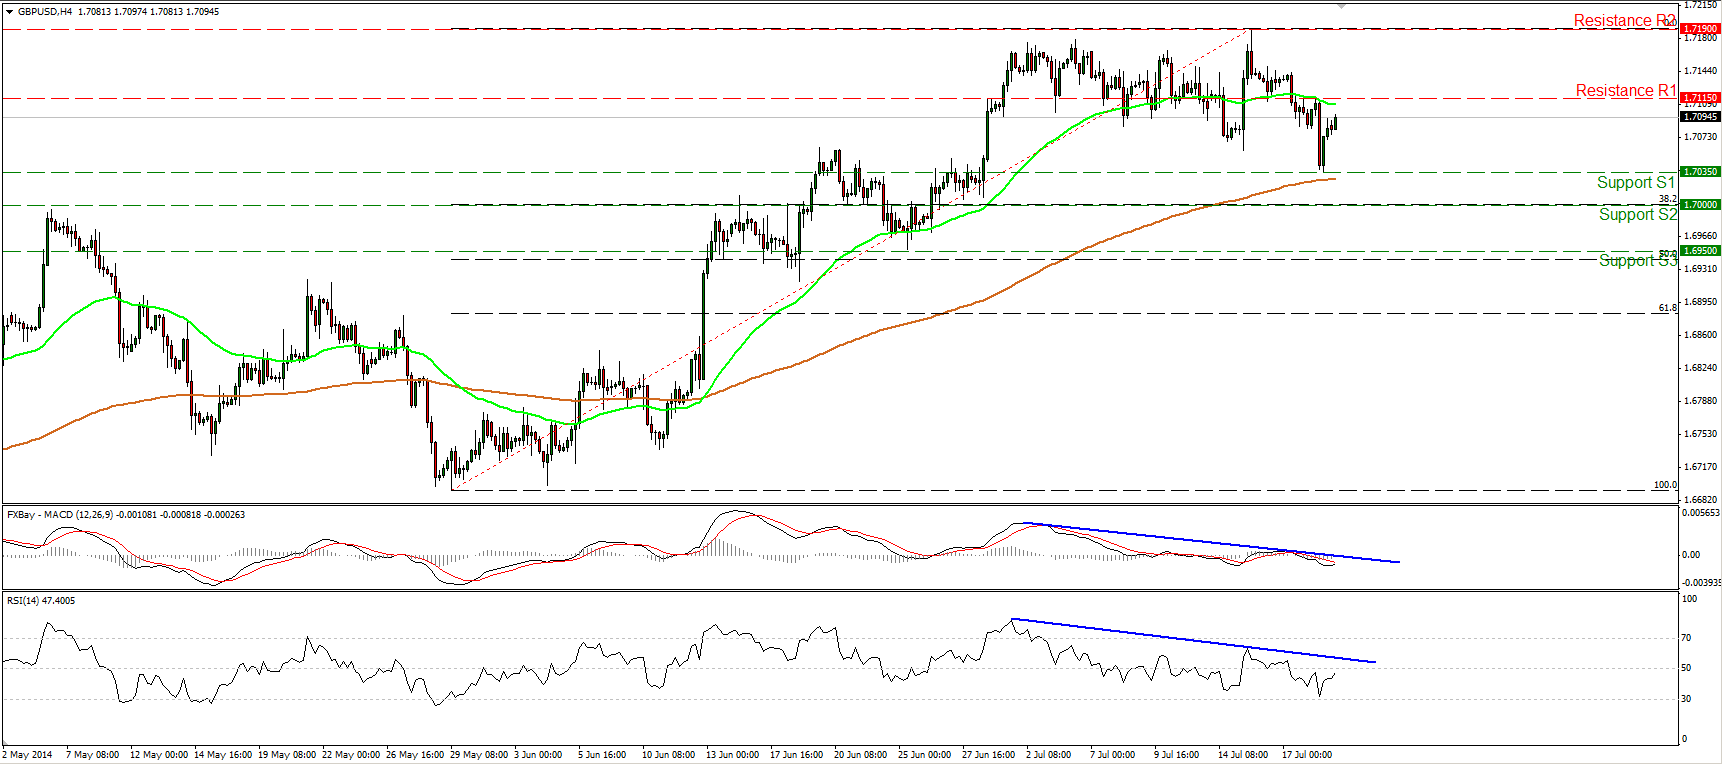
The GBP/USD moved lower on Friday, but after finding support at 1.7035 (S1) it recovered most of the lost ground. Despite the fact that the pair has remained trendless since 1 July, the negative divergence between our momentum studies and the price action indicate that GBP/USD may be topping and this keeps the near-term outlook mildly to the downside. However, in the bigger picture, the 80-day exponential moving average provides reliable support to the lows of the price action, keeping the long-term path to the upside. Thus I would consider any possible near term declines as a correcting phase of the major uptrend.
• Support: 1.7035 (S1), 1.7000 (S2), 1.6950 (S3).
• Resistance: 1.7115 (R1), 1.7190 (R2), 1.7300 (R3).
Gold finds support at 1305
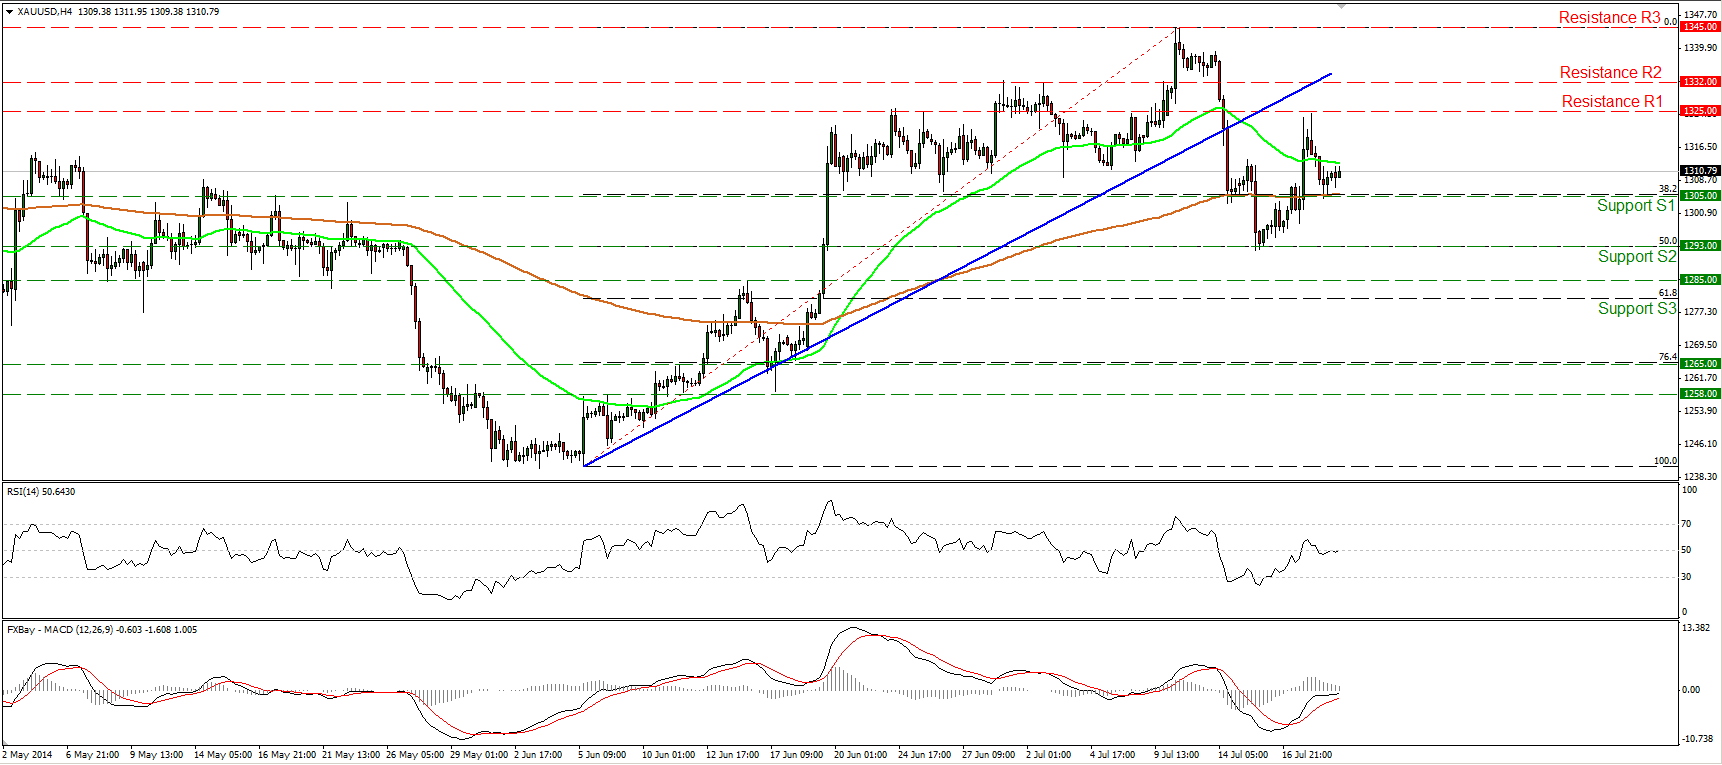
Gold tumbled on Friday but the decline was halted by the support of 1305 (S1), which coincides with the 200-period moving average. A rebound from that zone is likely to target once again the resistance of 1325 (R1). Nevertheless, our momentum studies give neutral signals. The RSI remains lies near its 50 line, while the MACD remains slightly below its zero line but is pointing sideways. Moreover, on the daily chart both the 50- and the 200-day moving averages are pointing sideways, adding to the unclear picture of the precious metal.
• Support: 1305 (S1), 1293 (S2), 1285 (S3).
• Resistance: 1325 (R1), 1332 (R2), 1345 (R3).
WTI pulls back
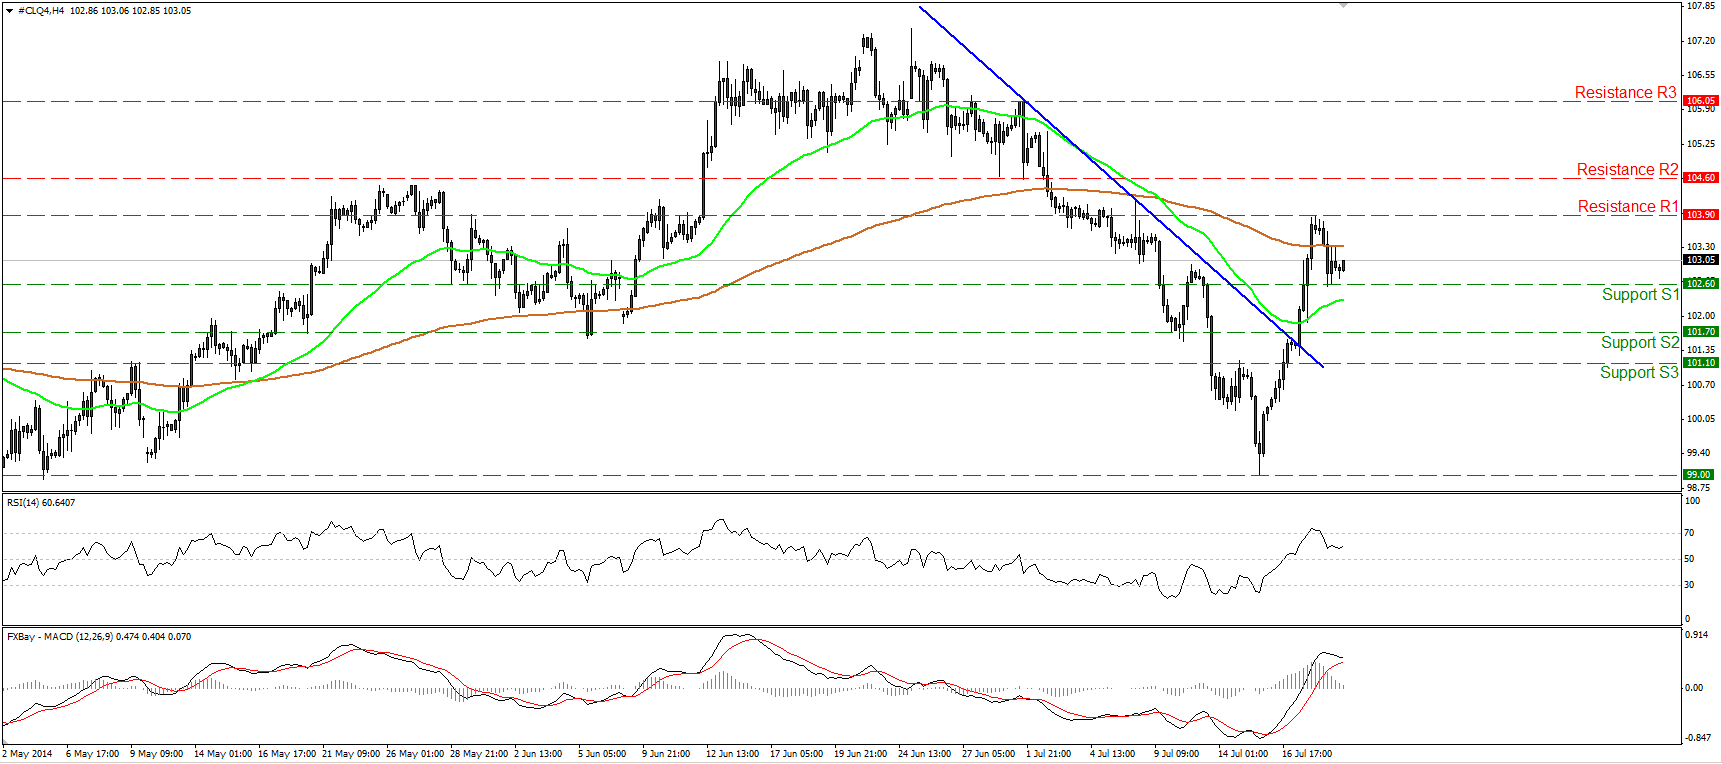
WTI pulled back after finding resistance at 103.90 (R1) and the decline met support at 102.60 (S1). The possibility for a higher low still exists and as a result I would consider Friday’s decline as a corrective wave of the prevailing strong rally. A rebound near the 102.60 zone could target again the 103.90 (R1) barrier, where an upside violation would confirm a forthcoming higher high and is likely to challenge the next resistance at 104.60 (R2). Zooming on the 1-hour chart, the 14-hour RSI seems ready to move above 50, while the hourly MACD shows signs of bottoming and a cross above its zero and signal lines is possible. This magnifies the case for a rebound and a higher low in the near future.
• Support: 102.60 (S1), 101.70 (S2), 101.10 (S3).
• Resistance: 103.90 (R1), 104.60 (R2), 106.05 (R3).

