
Chinese energy giant PetroChina Co. Ltd. (NYSE:PTR) announced third quarter 2016 earnings of RMB 1.2 billion or RMB 0.01 per diluted share, compared with RMB 5.2 billion or RMB 0.03 per diluted share a year earlier.
Earnings per ADR came in at 15 cents, failing to beat the Zacks Consensus estimate of 29 cents. Moreover, China’s dominant oil and gas producer’s total revenue for the three months under consideration fell 4% from the comparable 2015 period to RMB 411.4 billion.
The negative comparisons can be primarily attributable to continued collapse in oil prices, which pummeled its biggest unit – exploration and production – to a loss.
PetroChina followed another big energy name from the country – CNOOC Ltd. (NYSE:CEO) – in reporting dismal results. However, the third state-backed oil and gas firm, China Petroleum & Chemical Corp. (NYSE:SNP) saw its profits soar on refining gains.
PETROCHINA ADR Price, Consensus and EPS Surprise
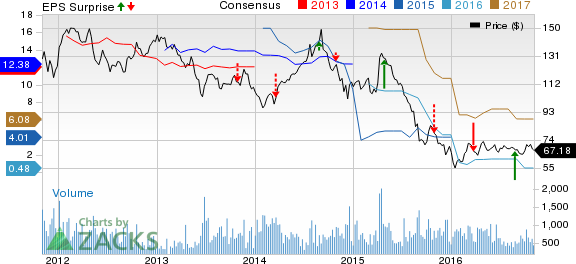
PETROCHINA ADR Price, Consensus and EPS Surprise | PETROCHINA ADR Quote
Nine-Month Segment Performance
Upstream: PetroChina, one of the world's largest oil company by market value and half the size of ExxonMobil Corp. (NYSE:XOM) , posted stable upstream output during the nine months ended Sep 30, 2016. While crude oil output – accounting for 65% of the total – fell 3.6% from the year-ago period to 696.6 million barrels (MMBbl), marketable natural gas output was up 6.1% to 2,428.9 billion cubic feet (Bcf). As a result, PetroChina’s total production of oil and natural gas remained essentially flat year over year at 1,101.5 million barrels of oil equivalent.
But average realized crude oil price during the first nine months of 2016 was $35.79 per barrel, representing a 30% decrease from the year ago period. To make things worse, natural gas price fell 27% year-over-year to $4.67 per thousand cubic feet (Mcf). This affected the upstream (or exploration & production) segment results, which swung to an operating loss of RMB 3.9 billion compared to an operating profit of RMB 46.5 billion in the first three quarters of 2015.
Downstream: The Beijing-based company’s ‘Refining & Chemicals’ business generated an operating income of RMB 34.3 billion. This is a significant increase from the year-earlier period earnings of RMB 3.1 billion. The improvement in the downstream division was due to cost control initiatives, higher share of high valued-added chemical products and operational flexibility to adjust to market conditions.
PetroChina’s refinery division processed 707.9 MMBbl of crude oil during the nine-month period, down 4.6% from 2015. The company produced 6.781 million tons of synthetic resin in the period (a rise of 15% year over year), besides manufacturing 4.147 million tons of ethylene (up 15.4%). It also produced 63.669 million tons of gasoline, diesel and kerosene during the period against 68.802 million tons a year earlier.
Natural Gas & Pipelines: Revenue fell 15% to RMB 174.7 billion on a sharp drop in natural gas prices, which was partly offset by improved pipeline transportation profitability. To combat the pricing woes, the Chinese behemoth enforced strict control in natural gas import costs, improved operating efficiency and adjusted its marketing strategy.
However, PetroChina lost money to the tune of RMB 10.6 million on the sales of imported natural gas and liquefied natural gas (LNG) from Central Asia and Burma. This pulled down the Zacks Rank #3 (Hold) group’s natural gas business’ income to RMB 17.9 billion in the first three quarters, a 29.7% decline from the year-earlier profit of RMB 25.4 billion. You can see the complete list of today’s Zacks #1 Rank (Strong Buy) stocks here.
Marketing: In marketing operations, the group sold 118.727 million tons of gasoline, diesel and kerosene during Jan–Sep 2016, reflecting a marginal 0.5% year-over-year decrease. Lower volumes were accompanied by a decrease in product prices due to which sales for the division were down 12% to RMB 929.1 billion.
However, PetroChina was able to counter the adverse factors – slow domestic refined products demand growth and fierce competition – by exploiting numerous marketing channels, optimizing the sales structure and utilizing international trade practices to its benefit. This meant that the segment swung to a profit of RMB 6.8 billion as compared to an operating loss of RMB 978 million incurred in the same period last year.
Liquidity & Capital Expenditure
As of Sep 30, 2016, PetroChina’s cash balance was RMB 120.8 billion, while net cash flow from operating activities was RMB 190.9 billion for the first three quarters of this year. Capital expenditure for the period reached RMB 114.1 billion, down 23% from the year-ago level of RMB 147.9 billion.
Confidential from Zacks
Beyond this Analyst Blog, would you like to see Zacks' best recommendations that are not available to the public? Our Executive VP, Steve Reitmeister, knows when key trades are about to be triggered and which of our experts has the hottest hand. Click to see them now>>
CHINA PETRO&CHM (SNP): Free Stock Analysis Report
CNOOC LTD ADR (CEO): Free Stock Analysis Report
PETROCHINA ADR (PTR): Free Stock Analysis Report
EXXON MOBIL CRP (XOM): Free Stock Analysis Report
Original post
Zacks Investment Research