Get 40% Off
🚨 Volatile Markets? Find Hidden Gems for Serious OutperformanceFind Stocks Now

Parsing JP Morgan's Q4 Outlook

Published 10/07/2016, 02:05 PM
Updated 05/14/2017, 06:45 AM

JP Morgan’s (NYSE:JPM) quarterly “Guide to the Markets” always contains plenty of interesting information for stock-market participants. Released at the end of each quarter, the research document is packed full of interesting numbers and statistics on market themes and style performance. Here is a summary of some of the data contained in the September 30 report.

JP Morgan Guide To The Markets For Q4

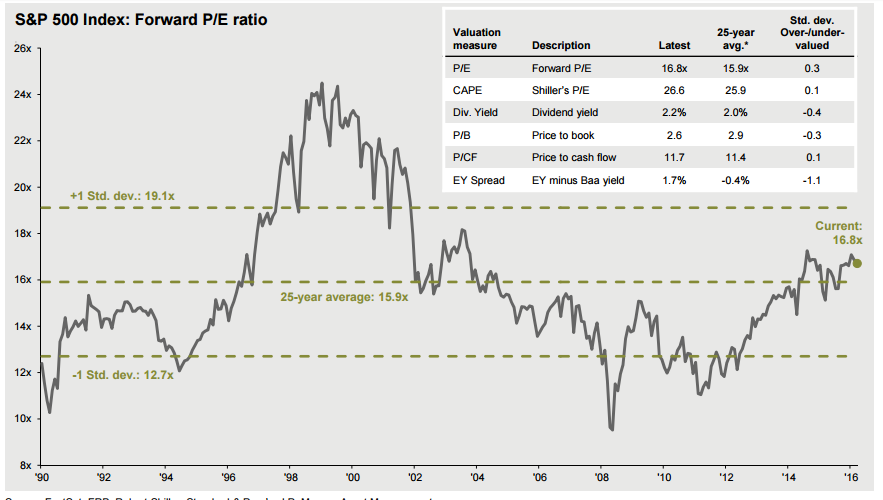
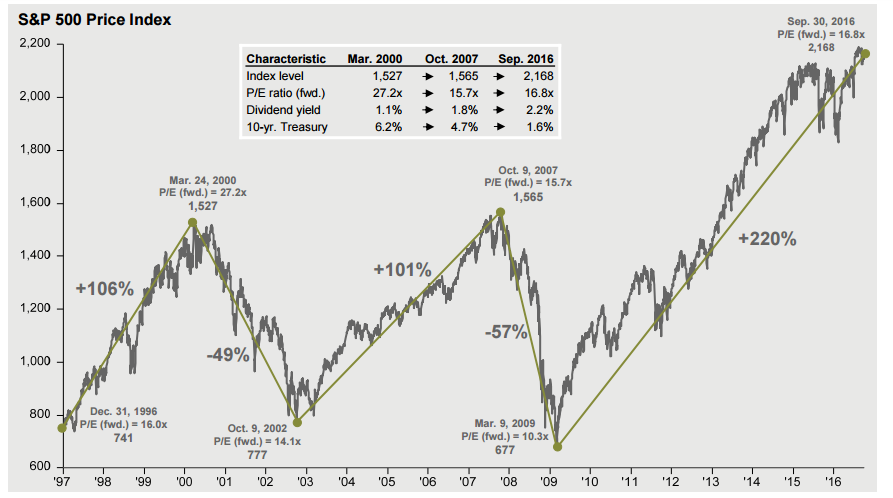
The leading chart of JP Morgan’s quarterly report is a breakdown of the current bull market. Between March 9, 2009 and the end of the third quarter of 2016, the S&P 500 has added 220%. From a low of 677 to a high of 2,168 the index has clocked the most impressive rally of the past two decades. Yet even after that rally, compared to the last two cycles the S&P 500 does not look to be overly expensive at current levels. Indeed, at the peak of the last bull market in October 2007 when the index traded at 1,565, the forward P/E ratio was 15.7 compared to today’s 16.8, although at the peak of the March 2000 bull market, the index was trading at a forward P/E of 27.2. The S&P 500’s current forward P/E ratio of 16.8 is overvalued by a standard deviation of 0.3 compared to the index’s 25-year average of 15.9.

Further, during both previous bull markets of the past two decades, the S&P 500’s average dividend yield ticked below 2% while today the index yields 2.2% -- an interesting phenomenon considering that today the 10-year Treasury rate is 1.6% compared to the March 2000 and October 2007 rates of 6.2% and 4.7%.

3rd party Ad. Not an offer or recommendation by Investing.com. See disclosure here or remove ads .

S&P 500: P/E Ratio
S&P 500

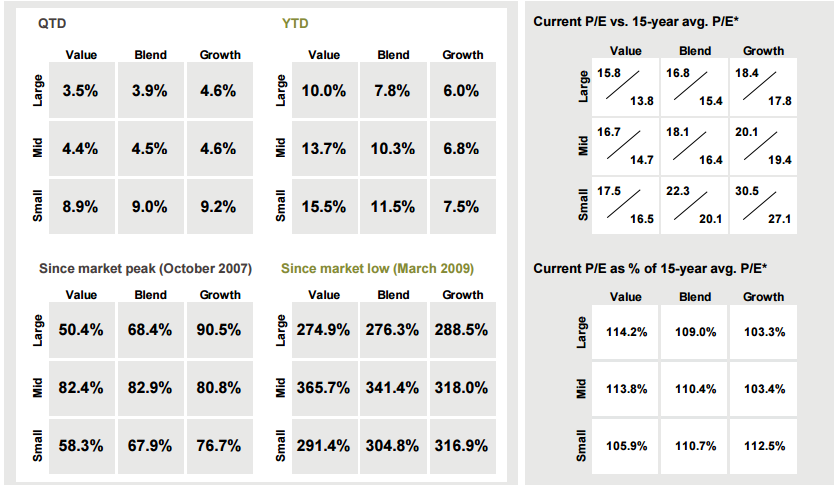
Value has seen a huge resurgence this year according to JP Morgan’s data. Year-to-date, small-cap value has returned 15.5%, mid-cap value has returned 13.7% and large-cap value has returned 10%. Meanwhile, small-cap growth has only returned 7.5%, mid-cap growth has returned 6.8% and large-cap growth has returned 6%.

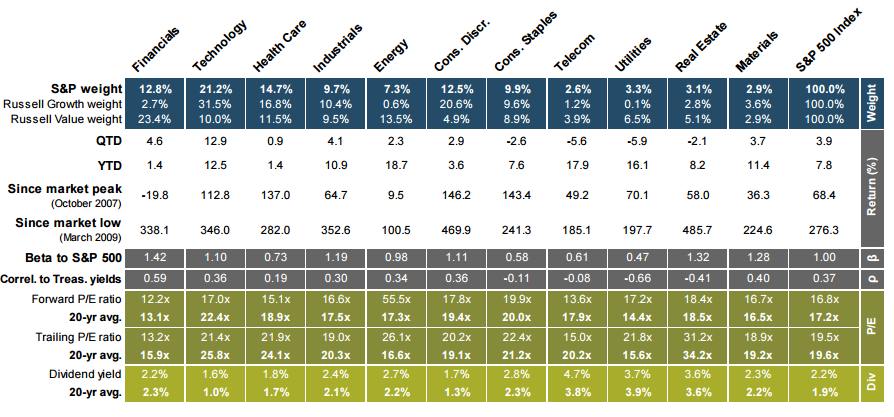
S&P 500 Sector Return
S&P 500 Performance By Market Cap

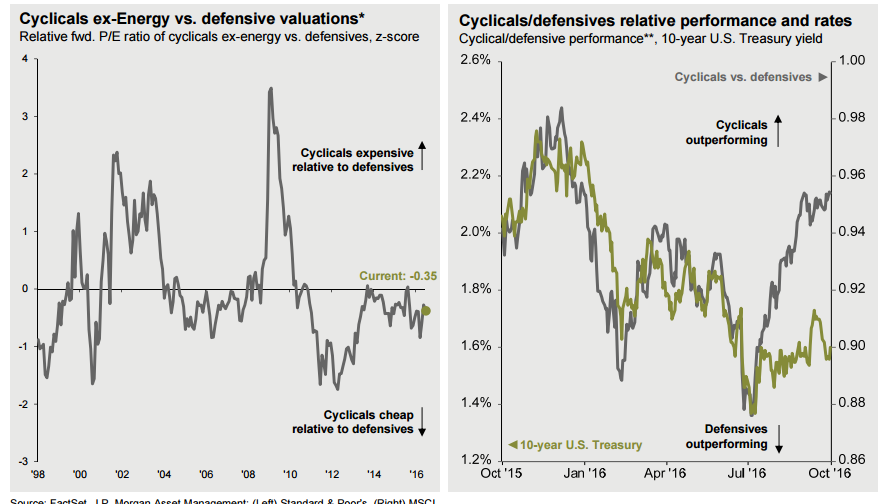
Cyclicals remain cheaper relative to defensives.

Cyclicals Vs. Defensives

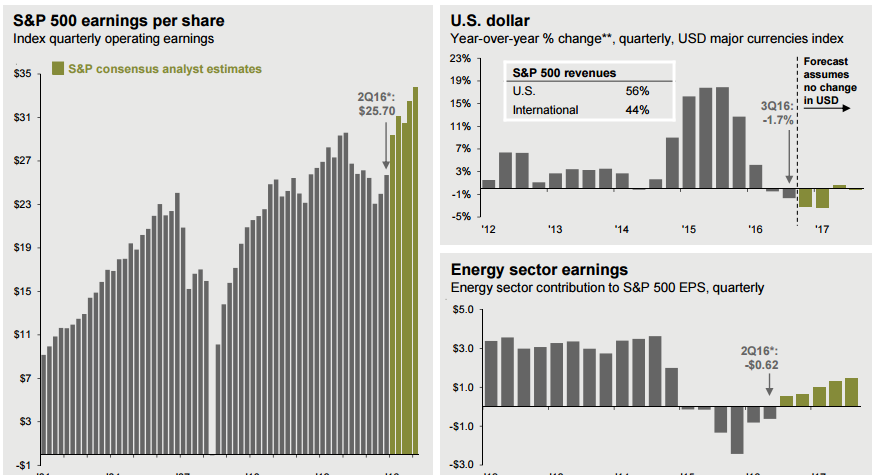
Quarterly Earnings: What To Expect

According to Wall Street consensus, S&P 500 quarterly earnings per share are expected to rise approximately 20% over the next few quarters.

Earnings Outlook

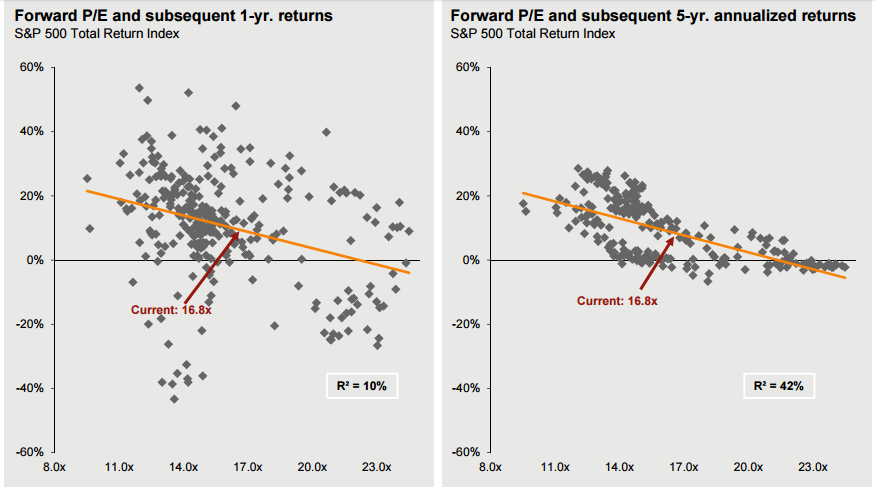
And the market’s current valuations suggests steady returns going forward.

S&P 500 Returns

Latest comments

Risk Disclosure: Trading in financial instruments and/or cryptocurrencies involves high risks including the risk of losing some, or all, of your investment amount, and may not be suitable for all investors. Prices of cryptocurrencies are extremely volatile and may be affected by external factors such as financial, regulatory or political events. Trading on margin increases the financial risks.
Before deciding to trade in financial instrument or cryptocurrencies you should be fully informed of the risks and costs associated with trading the financial markets, carefully consider your investment objectives, level of experience, and risk appetite, and seek professional advice where needed.
Fusion Media would like to remind you that the data contained in this website is not necessarily real-time nor accurate. The data and prices on the website are not necessarily provided by any market or exchange, but may be provided by market makers, and so prices may not be accurate and may differ from the actual price at any given market, meaning prices are indicative and not appropriate for trading purposes. Fusion Media and any provider of the data contained in this website will not accept liability for any loss or damage as a result of your trading, or your reliance on the information contained within this website.
It is prohibited to use, store, reproduce, display, modify, transmit or distribute the data contained in this website without the explicit prior written permission of Fusion Media and/or the data provider. All intellectual property rights are reserved by the providers and/or the exchange providing the data contained in this website.
Fusion Media may be compensated by the advertisers that appear on the website, based on your interaction with the advertisements or advertisers.
© 2007-2024 - Fusion Media Limited. All Rights Reserved.