As already stated before, my personal investment focus leans towards contrarian investing and opportunities of a depressed nature. With recent geopolitical risks elevating in Ukraine, I believe investors should take a look at the affected assets in Russia (in particular its stock market which has been declining for three years already). This is the first Investment Idea update, so lets kick it off.
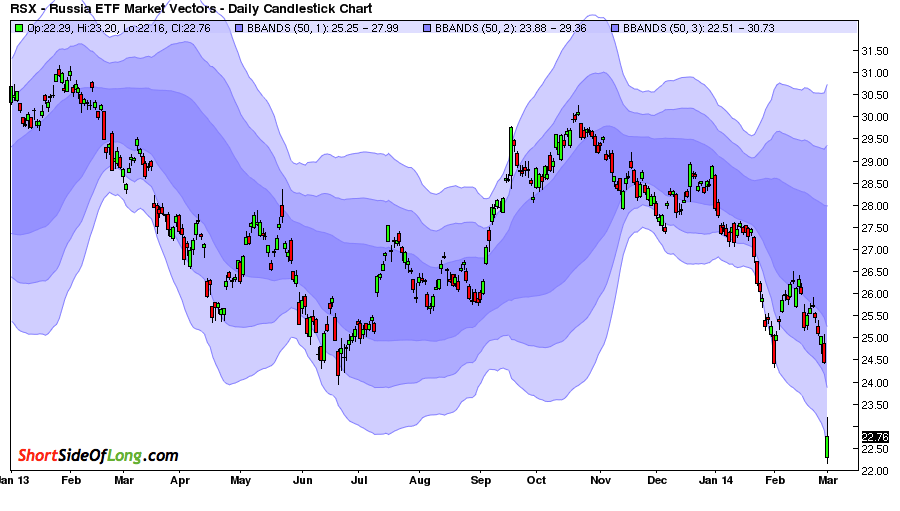
Chart 1: The Russian equity market crashed by over 12% yesterday!

Russian stock market (NYSE symbol: RSX) crashed yesterday, with intra day prices being pushed downward by more then four standard deviations away from the 50 day moving average. Official stock market index priced in US Dollars, called the RTSI (Russian Trading System Index) declined by more then 12%, moving into a five standard deviation event.
That is quite a rare sell off which is creating a favourable outcome as prices aren’t declining due to fundamental developments, but rather sentiment (outright fear). So I guess majority of investors would like to know whether or not this is this a buying opportunity or just a start of more selling to come?
While Russian equities are extremely oversold in the short term, all the major assets within the country are experiencing a rush of capital outflows (stocks, bonds and the currency). Whether or not we have seen the final capitulation still remains to be seen, but one thing is for certain: events such as the one we have been watching on our TVs between Russia, US, EU and Ukraine tends to mark the final phase of a bottoming process.
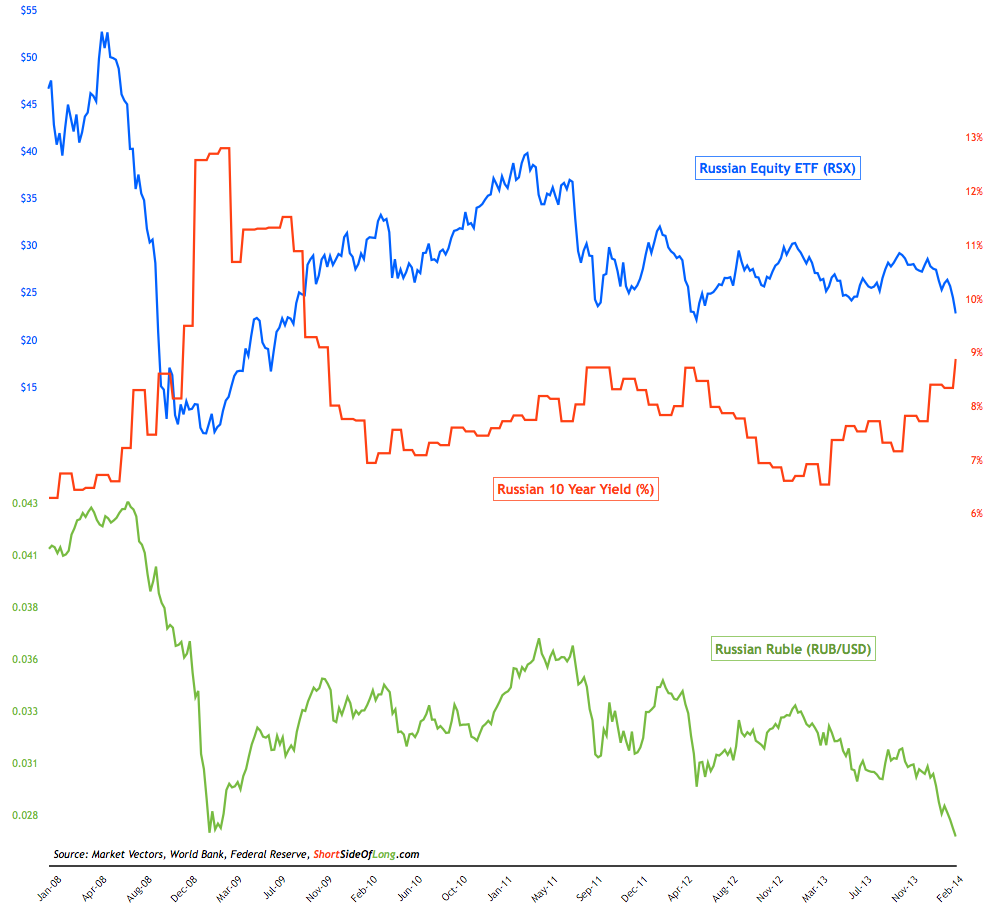
Chart 2: Equities and the currency is declining, interest rates are rising

The equity crash comes on the back of a three year bear market and under-performance relative to other global assets. By looking at Chart 2, investors should notice that periods of stock market under-performance are closely correlated with periods of currency depreciation and interest rate rises. In other words, whenever investors flee Russian assets, they sell both stocks and the bonds almost simultaneously, which is then followed by capital outflows weakening the currency in the process.
The recent bearish trend seems to have started in May 2013, as ex-chairman of Federal Reserve (Ben Bernanke) announced possibility of a taper. Majority of the emerging markets around the world came under pressure and Russia was definitely not excluded. Interest rates started to rise from low 6% handle towards 9% right now, currency fell towards record lows in recent days and the stock market has become extremely oversold.
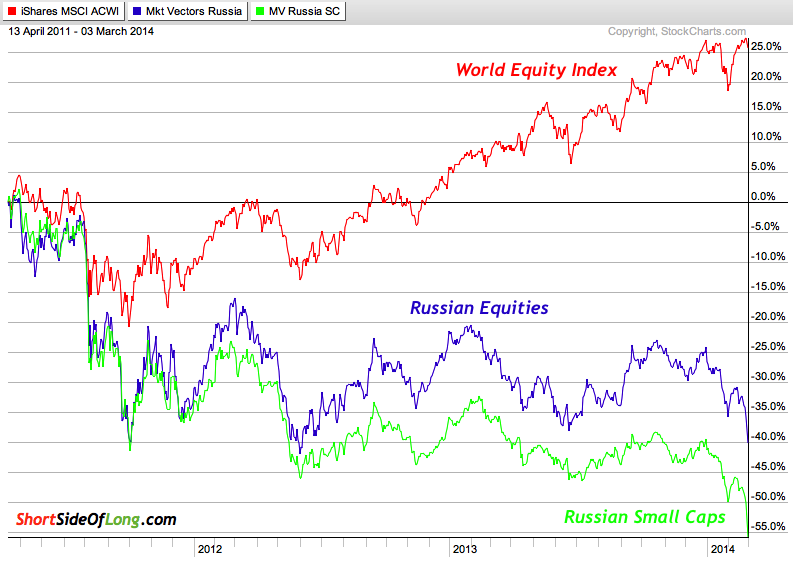
Chart 3: Huge under-performance by Russian equities over last 3 years

The equity market (priced in USD) peaked in April 2011 and has already been declining by almost three years. Even more interestingly, Russian equities made their all time high in the middle of 2008 and have not yet come even close to exceeding it. The RSX ETF remains 58% below its all time high set in 2008 and 43% below its recent major peak in April 2011. There is definitely value there compared to S&P 500, which is currently making all time record highs as I write this post.
Speaking of the peak in April 2011, Chart 3 shows how global equities have returned over 25% over the last three years, while Russian equities have posted a 40% drawdown. Even more interesting is the fact that Russian Small Caps (NYSE Symbol: RSXJ) have posted a 55% loss in the same period. It has been a tough three year period for Eastern European assets.
On relative basis, Russian equities (in USD) have been under-performing S&P 500 by a wide margin. This outperformance is now as over-stretched as it was during the depths of the Lehman crisis. Not only are stocks oversold and unloved, they are also super cheap by almost any valuation metric.
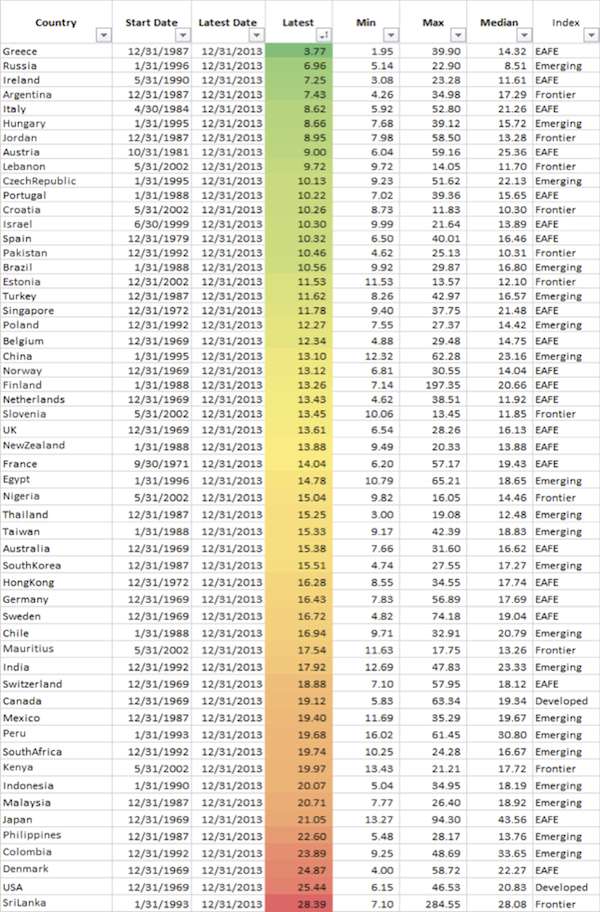
Chart 4: Russian equities are one of the cheapest markets in the world!

Whether we look at Price to Book (P/B) or Cyclical Adjusted Price to Earnings ratio (CAPE), Russian equities stand out as one of the cheapest stock markets in the world. As a matter of fact, out of the global majors, Russian Index is the cheapest. It trades well below book value and at only 7 CAPE10 (chart above). However, since the valuation data is slightly outdated, I would assume these assets have only gotten cheaper with the recent panic sell off.
Furthermore, Russian assets become even more attractive when one analyses simple economic and financial fundamentals. In 2013, Russian Debt to GDP ratio was at only 8.4%. Yes, that is not a typo. Its protective war chest is also quite large, as the country now holds just under $500 billion in foreign exchange reserves. Russian employment rate remains steady at 5.5% (for now), which is still relatively low compared to 14% we saw during its default crisis in 1998. And generally speaking, inflation has been trending lower since early 2000s.
Unlike many other global economies, Russia is one of the top global energy exporters, so with the rising price of Crude Oil (Brent recently at $110 per barrel) and the falling currency, current account conditions should improve in the near future. However, with such high reliance on energy exports, Crude Oil prices remain the Achilles Heel of the Russian economy. As long as Brent trades at high levels, economic prospects remain favourable.
Bottom Line
Russian stock market has become oversold in the short term. After a initial rebound in prices, we need to see what kind of a trend the market will take in the next several weeks. RTSI is definitely becoming extremely oversold by technical measures, but that does not mean it cannot get even more oversold. Weekly RSI level is currently at 24, which is the third most oversold reading after the 1998 Russian Default and 2008 GFC. Volatility is starting to pick up, but true bottoms usually occur when Bollinger Band width expands to levels much higher than we find it today. I would also like to see Russian Consumer Confidence fall further in coming months, creating a contrarian signal to start purchasing stocks.
Under-performance relative to US and global equity indices over the last three years will not last forever and eventually Russian stocks will enter some kind of a mean reversion mode (like we saw from March 2009 until April 2011). Obviously, certain group of bearish investors would make a claim that Russian stocks traditionally trade at lower multiples and valuations due to corruption problems and lack of political & business transparency. While this is true, nevertheless we find this stock market at ridiculously cheap levels.
Bottom line: I am not yet purchasing Russian equities, but I have certainly turned bullish. Right now I continue to watch only, but my preparation to go ahead with net long positions is complete. Every crisis presents an opportunity and this one will definitely not be any different. The most important part is to let majority of the selling play out and once the bears start showing signs of exhaustion, long positions can be initiated.
