Technical analysis is the study of price history. This means the study of supply and demand for a stock. Not a company or a product, just the stock. Many cannot make the leap from a product or a company to detaching that from the stock. But it is essential to understanding stock price action.
There are reams of pages written about Technical Analysis (TA). And most are written so long ago that the charts used to illustrate the concepts are of companies that no longer exist. The Bible of TA, Technical Analysis of Stock Trends by Edwards and Magee is in its 10th edition, and was originally published in 1948. It is still relevant but you can become detached reading it, looking at charts of Anaconda Copper or Zenith Radio. So why not rent a video about it at Redbox?
Learning has always been about practical application for me, so I like to be able to see how stock charts and price action changes while I am measuring. This is why I used current charts in my book on applied technical analysis. The evolution is important and needs to be tangible.
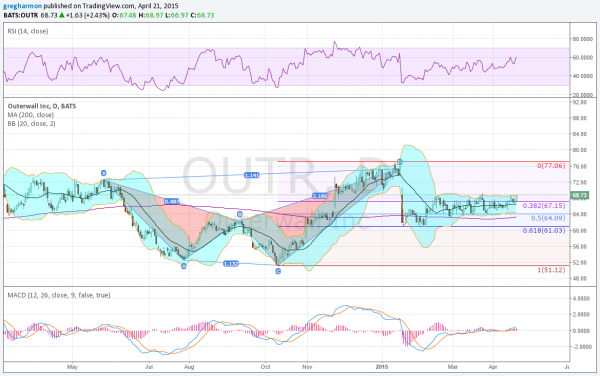
Today offers another example of that in a current chart and with one of the newer branches of TA, Harmonics. The chart of Outerwall Inc (NASDAQ:OUTR) below illustrates the process at work.

Outerwall started to develop the recognizable ‘W’ pattern in May 2014. A drop down to the low in July and then a bounce to near a 50% retracement was followed by another decline, reaching just over 113% of the initial leg lower. These ratios define a bearish Shark harmonic and look for a move back higher to 88.6% or 113% of the initial XA leg. in this case it ran just beyond 113% before the bearish trigger kicked in. The stock then wasted no time in retracing 61.8% of the entire pattern before finding support. Harmonics in action.
This process reset the momentum indicators and since the bottom it has moved in a tight consolidation. The Bollinger Bands® have tightened and are running sideways now, as the price is making a second test at the top of the range. Notice that the lows are slightly increasing through the consolidation. This is now setting up for a possible move higher. With the RSI and MACD now rising, in support of a break to the upside, you can look for a trade opportunity on a break over the top of the range at 69.
Disclaimer: The information in this blog post represents my own opinions and does not contain a recommendation for any particular security or investment. I or my affiliates may hold positions or other interests in securities mentioned in the Blog, please see my Disclaimer page for my full disclaimer.
