Sentiment
US stocks
Weighted Normalized Sentiment (WA and WAS)
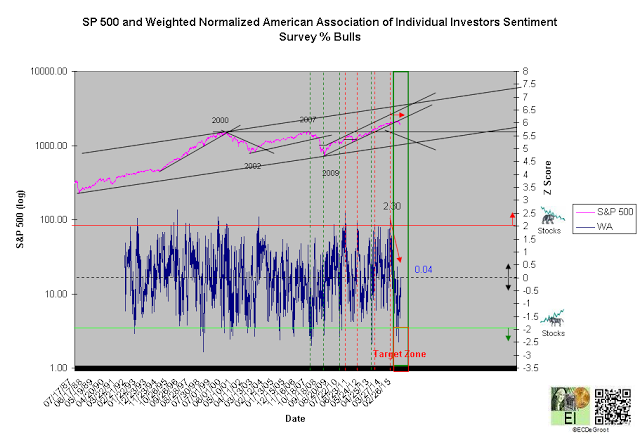
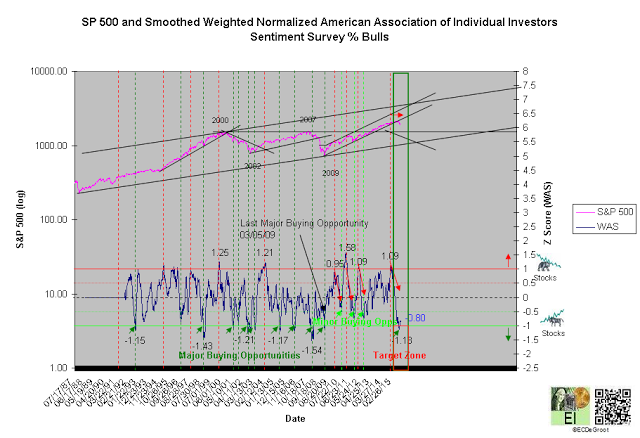
The unwinding of optimism to a neutral sentiment position (chart), the transfer of ownership in which the minority fades the actions of the majority within cause, has been ongoing since late November 2014. This transfer is driven by human behavior that cycles all markets from greed (optimism) to fear (pessimism), and vice versa (see cycle). The positive to negative oscillation of weighted normalized sentiment (WA) and smoothed weighted normalized sentiment (WAS), or unwinding process within intermediate and long-term cycles, illustrates this transfer from greed to fear (chart 1 and 2).
Bullishness towards US stocks grows as WA and WAS approach their target zones. WA and WAS of 0.04 and -0.80 suggest that the greed to fear transition, ongoing since November 2014, has either ended or will end sooner than bears expect. A fear to greed transition suggests that distribution is closer to the end than the beginning (chart 1 and 2). This transition, likely well-defined in 2016, contradicts a growing list of bearish calls suggesting a long bear market is near.
Cause produces minor and major buying opportunities when WAS falls below 0 and -1, respectively. The last major buying opportunity (MBO) for US stocks was generated at -1.08 (WAS) and 712.54 (S&P 500) on 03/05/09. Another MBO was generated at -1.13 and 1940.51 on 08/27/15. Since a backdrop of intense fear can send WAS below -1.50, caution is advised until the sentiment oscillator confirms a new up impulse (see sentiment oscillator)
While the IMF begs US Federal Reserve not to raise rates, they fail to recognize that the Fed, a follower of market forces and its own self interests, will raise rates to deflect safe haven capital flows and blame for the growing insolvency of public pension funds throughout the US and insurance companies as the next crisis 'unexpectedly' punishes those heavily exposed to bonds. A rising interest rate trend is neither a byproduct of strong domestic or global economic growth nor indecisiveness within the Fed.
Sentiment Oscillator
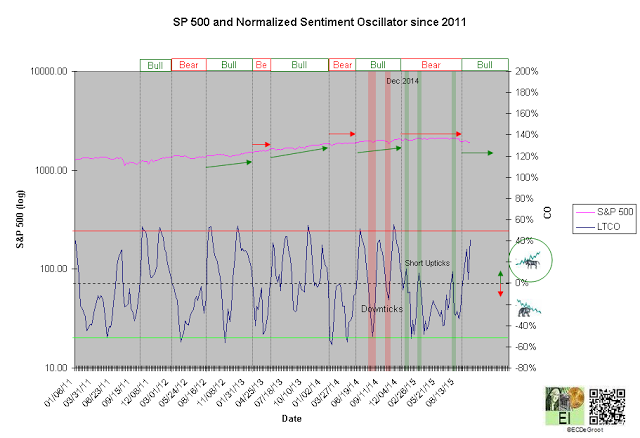
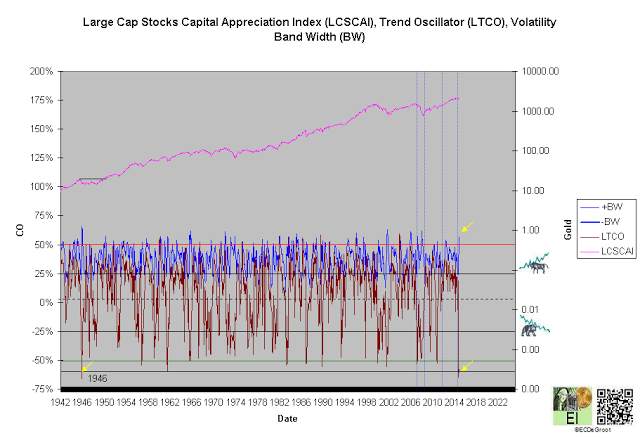
A negative long-term sentiment oscillator (LTCO) defines an down impulse and pessimism towards stocks, while a positive trend oscillator defines an up impulse and optimism. A negative oscillator, opposed by three short upticks lasting one to three weeks confirmed cause building, pessimism towards stocks, and bear sentiment phase since December 2014 (chart 3). A positive long-term sentiment oscillator (LTCO), however, not only defines an up impulse (rally) from 1942.02 to 1995.83 but also a sentiment transition from bear to bull since the second week of September. This trend has been tightening risk management for bears for several week. The bulls or optimism control sentiment and US stock trend until reversed by a bearish crossover.
Sign of Strength (SOS) or Sign of Weakness (SOW)
Stocks bullish bias within cause, the manifesting of strong inflows from Asia, Europe, and emerging markets into US stocks, has supported a running correction for months. This bias, a definitive SOS and consistent observation within cause since 2009, eludes recognition from a majority (public) that generally doesn't trusts stocks.
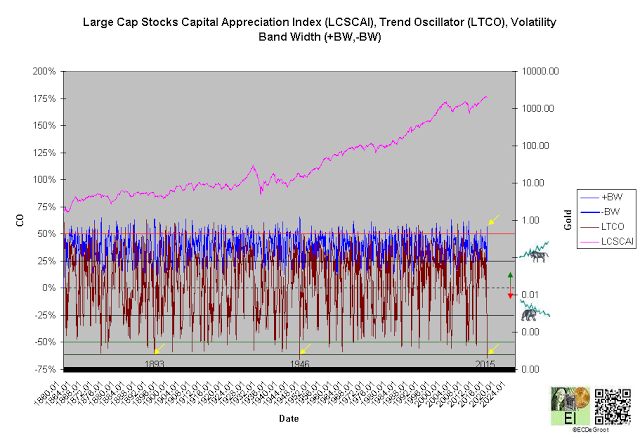
Some cite a tight trading range as a source of this distrust and SOW for stocks. While compression, BW falling below 25% and approaching 0% after months of rising prices, tightened risk management for bulls in July (BW = 24.4%), it was not extreme. Extreme compression, BW falling below 20% ahead of major tops and bottoms, hasn't been observed since mid 2006 (top) and early 2009 (bottom). Even worse, the majority, notorious market timers, will be 'true believers' of stocks when extreme compression advises them to sell. Compression, relatively rare technical setups, are highlighted blue dotted lines (chart 3A and 3B). Only a small minority of investors listening to the message of the market rather than following the majority (herd), recognize extreme compression as the precursor to a major trend inflection.
Chart 1
Chart 2
Chart 3
Chart 3A 1860-1942
Chart 3B 1942-2025
Intermarket Analysis
Composite Timing Indicator (CTI)
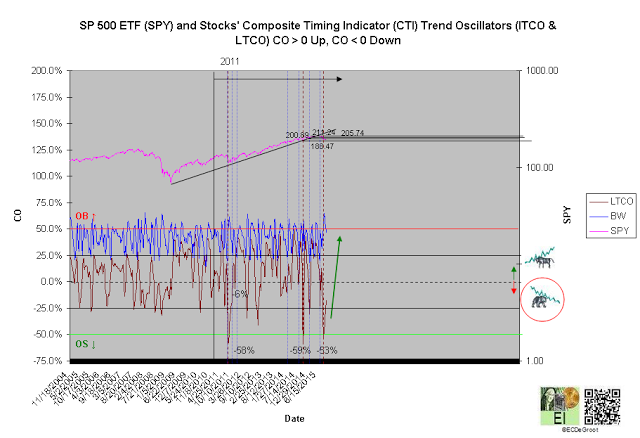
A negative long-term trend oscillator (LTCO) defines a weak down impulse (decline) within cause from 197.63 to to 199.43 (chart 4). Human behavior, the force the drives all markets, predicts overbought (OB) will follow oversold (OS), and vice versa (see cycle). This transition, an natural oscillation that goes largely unrecognized by the majority, tightens risk management for bears. LTCO of -53% on 08/31/15, the third lowest reading since 2011, tightened risk management for bears. The bears control the trend until reversed by a bullish crossover.
A positive long-term trend oscillator (LTCO), the definition of a rising trend and dominant observation since 2011, have been dismissed by a skeptical majority scarred by painful memories of 2007-2009 bear market. Stocks relentless rally, a persistent advance yet to produce an obvious entry point for the majority, will likely force them to chase higher prices.
Volatility Index (VIX)
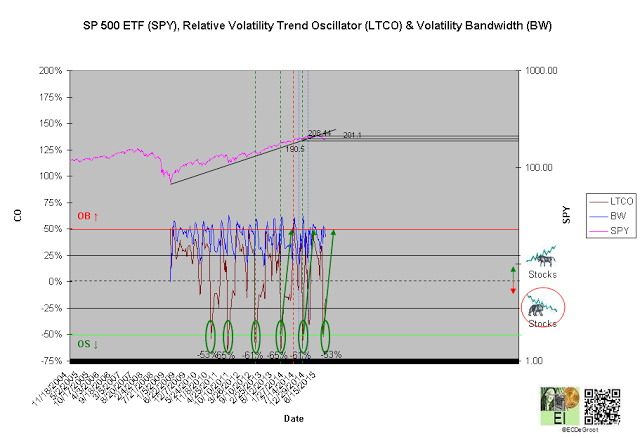
A negative long-term trend oscillator (LTCO) defines a down impulse that confirms CTI's (chart 6). February's overbought (OB), generated at 211.24 (NYSE:SPY), has been followed by oversold (OS). LTCO of -53% on 08/31/15, the sixth lowest reading since 2010, tightened risk management for bears. The bears control the trend until reversed by a bullish crossover.
Traders looking to buy stocks must remain patient. A false breakdown against the secular up trend, either short (1926- 1987-style) or longer, is ongoing. Duration, possibly driven by a Fed raising rates towards year end, should be resolved by the fall transition (see time Review of US Stocks).
Small Cap to Large Cap Ratio
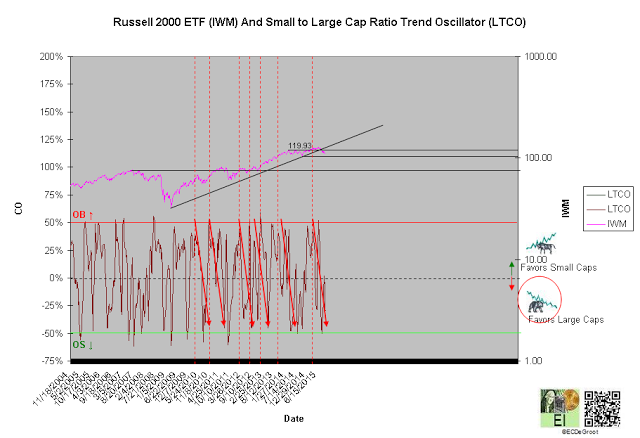
A negative long-term trend oscillator defines a down impulse since the third week of July (chart 5). Large cap outperform small caps until reversed by a bullish crossover. Again, human behavior, the force that propels all markets, predicts oversold (OB) follows overbought (OS) (see cycle). LTCO of -55% on 08/10/15, the definition of OS, tightened risk management for traders spreading small and large cap stocks. OS tightened risk management on SPY (longs) and NYSE:IWM (shorts).
Chart 4
Chart 5
Chart 6

