Get 40% Off
🚨 Volatile Markets? Find Hidden Gems for Serious OutperformanceFind Stocks Now

OPEC Deal Sends Energy Stocks Higher; Gold Falls By 1.4%

Published 12/01/2016, 03:50 AM
Updated 08/29/2019, 07:20 AM

OPEC leaders agreed yesterday to curb production by 32.5 million barrels, formalizing the Algiers Accord. The agreement sent oil prices shooting up by over 9% on the day leading energy stocks higher as well. Gold prices fell by over 1.4% in yesterday's trading session and down by over 8.4% on the month in November as prices fell to a fresh 9-month low. On the economic front, the U.S. dollar got a boost with a solid ADP payrolls print yesterday as it sets the stage for tomorrow's nonfarm payrolls report.

EUR/USD Intra-day Analysis
EUR/USD 4 Hour Chart

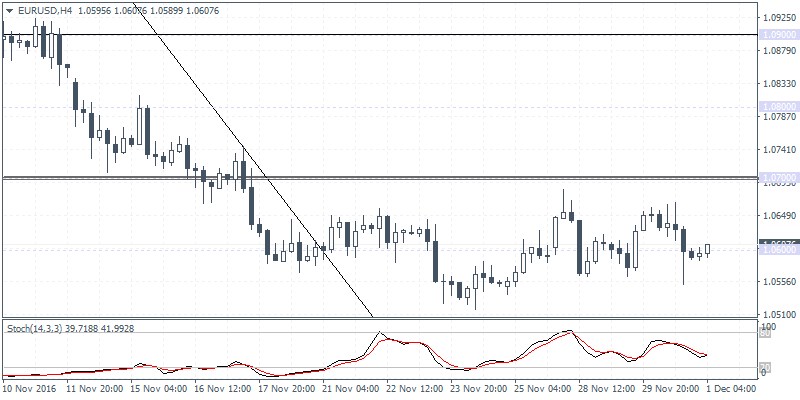
EUR/USD (1.0607) fell to below 1.0600 support yesterday as noted and prices could be seen pushing higher in the near term if the support at 1.0600 holds. On the intraday charts, EUR/USD is seen trading flat within 1.0700 resistance and 1.0500 support level. A breakout from either of these two levels is required to establish further trend continuation in the near term. The downside risks remain towards 1.0500, while above the resistance of 1.0700, prices could be seen rising to 1.0800.

USD/JPY Daily Analysis
USD/JPY Daily Chart

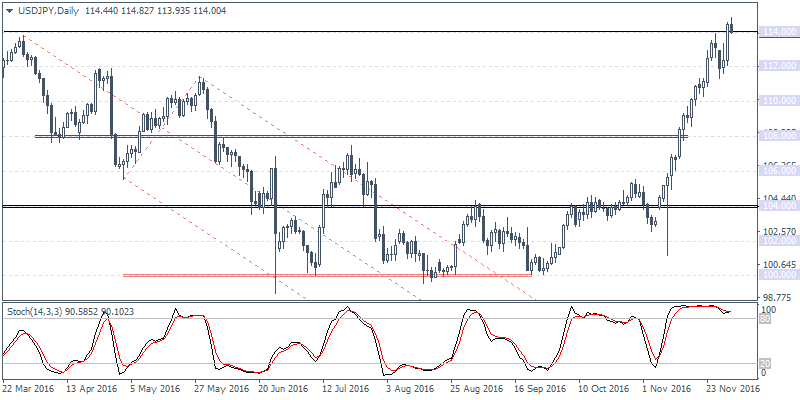
USD/JPY (114.00) gains towards 114.00 resistance were realized yesterday and from this resistance the scope for a decline to 108.00 increases even more. Following yesterday's strong performance, which saw USD/JPY rising over 1.85%, today's daily close will be of importance as price trades near this key resistance level. A reversal here could send the dollar lower in the near term, while a continuation could see USD/JPY rise towards 118.00 which is the next main level of importance.

3rd party Ad. Not an offer or recommendation by Investing.com. See disclosure here or remove ads .

XAU/USD Intra-day Analysis

XAU/USD 4 Hour Chart

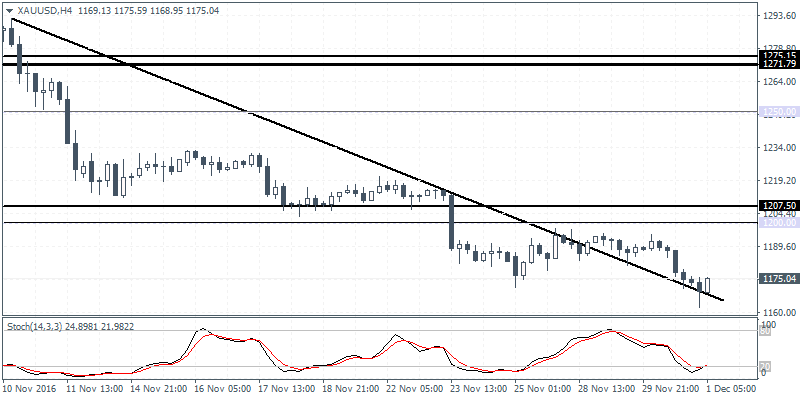
XAU/USD (1175.04) prices fell sharply yesterday in today's session testing the lows of 1162. On the 4-hour chart, we see prices being supported by the trend line which could signal the potential to the upside. 1200.00 now turns to a key resistance level, and a breakout above this level is essential to ascertain further gains. To the downside, the next psychological support at 1150 is not too far away and could pose a risk of a decline to this level.

Latest comments

Risk Disclosure: Trading in financial instruments and/or cryptocurrencies involves high risks including the risk of losing some, or all, of your investment amount, and may not be suitable for all investors. Prices of cryptocurrencies are extremely volatile and may be affected by external factors such as financial, regulatory or political events. Trading on margin increases the financial risks.
Before deciding to trade in financial instrument or cryptocurrencies you should be fully informed of the risks and costs associated with trading the financial markets, carefully consider your investment objectives, level of experience, and risk appetite, and seek professional advice where needed.
Fusion Media would like to remind you that the data contained in this website is not necessarily real-time nor accurate. The data and prices on the website are not necessarily provided by any market or exchange, but may be provided by market makers, and so prices may not be accurate and may differ from the actual price at any given market, meaning prices are indicative and not appropriate for trading purposes. Fusion Media and any provider of the data contained in this website will not accept liability for any loss or damage as a result of your trading, or your reliance on the information contained within this website.
It is prohibited to use, store, reproduce, display, modify, transmit or distribute the data contained in this website without the explicit prior written permission of Fusion Media and/or the data provider. All intellectual property rights are reserved by the providers and/or the exchange providing the data contained in this website.
Fusion Media may be compensated by the advertisers that appear on the website, based on your interaction with the advertisements or advertisers.
© 2007-2024 - Fusion Media Limited. All Rights Reserved.