Get 40% Off
🚨 Volatile Markets? Find Hidden Gems for Serious OutperformanceFind Stocks Now

Oil States Stock: Textbook Elliott Wave Setup

Published 12/27/2016, 07:16 AM

Oil States International Inc (NYSE:OIS), founded in 1937, provides services to oil and gas companies. With a market cap barely exceeding $2 billion, you might ask what is so interesting about this stock. The answer – its charts, of course. The size of the enterprise should not matter, because the stock prices of both large and small companies follow the same Elliott Wave rules. And right now, Oil States stock is very interesting and perhaps… dangerous. The daily chart below explains why.
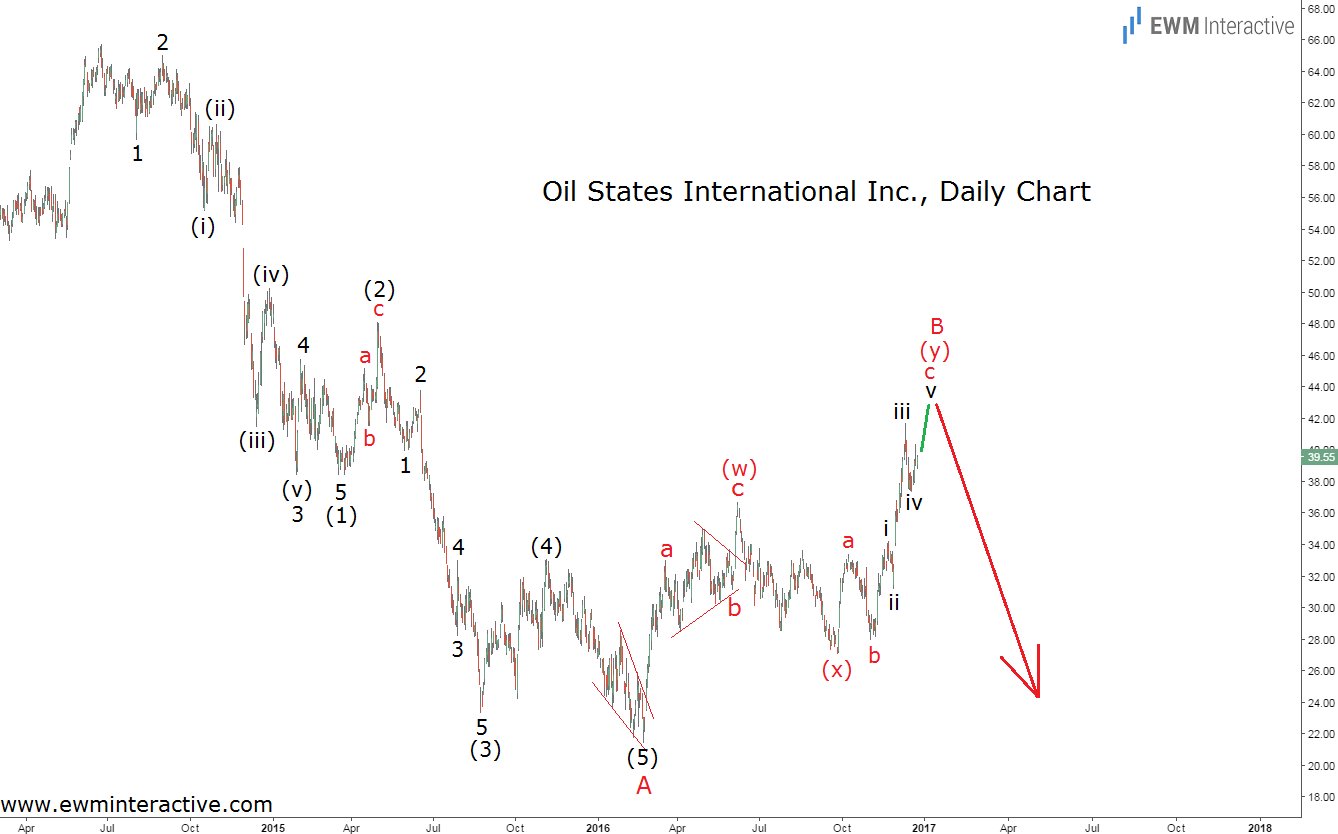
Oil States International Inc Daily Chart

What we have here is a textbook example of a 5-3 wave cycle pointing to the south. Between June 2014 and February 2016, Oil States fell from $65.77 to as low as $21.44, losing over two-thirds of its market value. Two weeks ago, the stock managed to recover to $41.75, which probably makes investors believe the worst is already behind them and now is the time to jump on board again. Unfortunately, this does not seem to be the case, because if we take a look at the chart above, we will see that the crash to $21.44 takes the shape of a perfect five-wave impulse. The sub-waves of waves (1) and (3) are also clearly visible, while wave (5) is an ending diagonal.

According to the Elliott Wave Principle, every impulse is followed by a three-wave correction in the opposite direction. That is what we think has been in progress since February. If we label the impulsive weakness as wave A, the corrective recovery in wave B appears to be a (w)-(x)-(y) double zig-zag. B-waves could be very dangerous, because all they do is give false hopes. In this case, Oil States stock has nearly doubled from its February lows. Unfortunately, if this is the correct count, the worst is yet to come, because once wave B is over, the bears are supposed to take the wheel again.

3rd party Ad. Not an offer or recommendation by Investing.com. See disclosure here or remove ads .

Furthermore, their next stop lies somewhere below the bottom of wave A. In other words, Oil States stock might lose all of this year’s gains plus more. We would not be surprised to see the $20 mark taken out by the bears. That is why now is not the time to join the bulls. Their reign is almost over.

Original post

Latest comments

Risk Disclosure: Trading in financial instruments and/or cryptocurrencies involves high risks including the risk of losing some, or all, of your investment amount, and may not be suitable for all investors. Prices of cryptocurrencies are extremely volatile and may be affected by external factors such as financial, regulatory or political events. Trading on margin increases the financial risks.
Before deciding to trade in financial instrument or cryptocurrencies you should be fully informed of the risks and costs associated with trading the financial markets, carefully consider your investment objectives, level of experience, and risk appetite, and seek professional advice where needed.
Fusion Media would like to remind you that the data contained in this website is not necessarily real-time nor accurate. The data and prices on the website are not necessarily provided by any market or exchange, but may be provided by market makers, and so prices may not be accurate and may differ from the actual price at any given market, meaning prices are indicative and not appropriate for trading purposes. Fusion Media and any provider of the data contained in this website will not accept liability for any loss or damage as a result of your trading, or your reliance on the information contained within this website.
It is prohibited to use, store, reproduce, display, modify, transmit or distribute the data contained in this website without the explicit prior written permission of Fusion Media and/or the data provider. All intellectual property rights are reserved by the providers and/or the exchange providing the data contained in this website.
Fusion Media may be compensated by the advertisers that appear on the website, based on your interaction with the advertisements or advertisers.
© 2007-2024 - Fusion Media Limited. All Rights Reserved.