Talking Points
- Light risk demand in Asia followed heavy sell-off in US.
- Oil plunged below 44 to week’s low, after sliding on swelling stockpiles per API.
- Copper edged up on tumbling inventories and output cuts.
- Gold at month’s low as US job openings data bolstered case for rate rise.
Risk sell-off during the US and early Asian sessions was as violent as the prior day’s rally, until the Shanghai Composite saved the day, again. As it steadily edged up after the open, regional stock indices and commodity currencies bounced back (notwithstanding AUD’s climb on high job data).
Nevertheless, commodities have detached from swings in asset market today as fundamental factors re-surfaced and investors seemed extremely sensitive to price action.
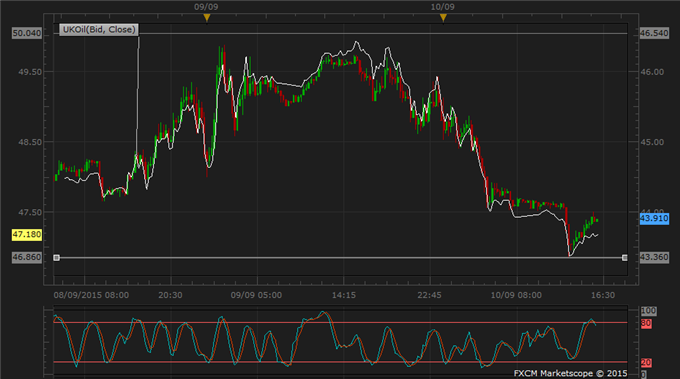
Oil crashed below $44 to the lowest this week at 43.36 at mid-morning Asia, perhaps as stops were tripped after it flirted with the 44 support level all morning. Downside support is weak after oil prices passed 23.6% Fibo on both the daily and weekly charts, and came close to a technical support at 43.21.
Oil also experienced high volatility overnight and gave back gains from Tuesday’s rally after delayed report by the American Petroleum Institute outlined an unexpected stockpile increase of 2.1 million barrels. The EIA’s Short-Term Energy Outlook was less of a driver as its forecast of a drop in daily consumption met with 1.5 percent drop in daily output for 2016. The agency will release much waited weekly inventory report today.
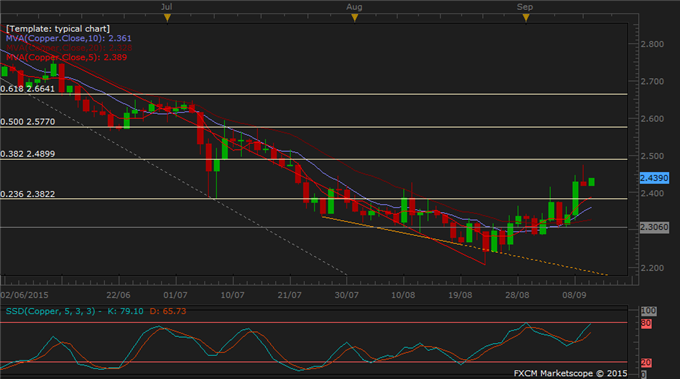
Copper gradually edged up since the close of NYSE and so far seemed oblivious to swings in Shanghai shares or other commodities. Prices fell from a seven-week high at 2.4755 yesterday, along with other metals and US stocks. Producer prices in China extended a 42-month decline, underlining slow factory growth.
However copper prices look to gather support from China’s tumbling bonded-warehouse inventories (estimated by Bloomberg) and collective output cuts by large producers including Glencore (OTC:GLNCY), Freeport-McMoran (NYSE:FCX), Asarco and Ok Tedi.
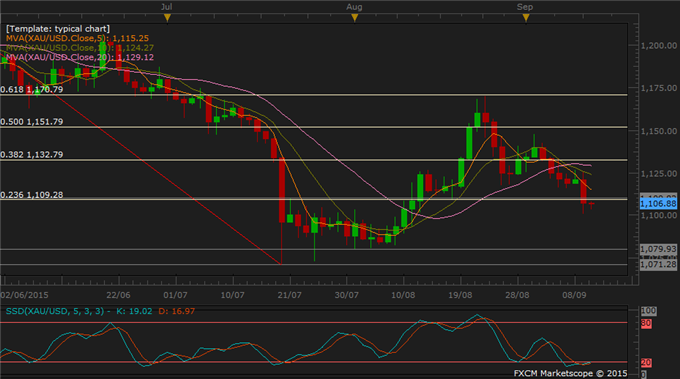
Gold’s recurring daily drop was exacerbated after a record high US Job openings triggered its plunge to 1101.43, a new monthly low. The JOLTS number indicated labour market is tightening and strengthened the case for the Fed to raise rates by year end.
GOLD TECHNICAL ANALYSIS
Gold swung around in the Asian session after falling to 1101.43 below a previous support level at 1101.72. This daily low will likely be a floor to intraday prices today. Prices also dropped past 23.6% Fibo and there is no other technical levels to keep trace of on the downside until 1079.9, the bottom of July-August trough. Moving averages have lined up to form downtrend signal thus this week’s focus will be on the downside.

COPPER TECHNICAL ANALYSIS
Yesterday copper halted the climb ahead of 38.2% Fibo at 2.4899 and it may respect this resistance level today. However, an uptrend signal is forming and there seems to be no hindrance on the way up apart from the Fibo level. Only repeated failures to break resistance would better indicate a correction or even reversal in copper.

CRUDE OIL TECHNICAL ANALYSIS
WTI oil quickly bounced back after it crashed to 43.36 today. Intraday momentum is poised to a reversal from the upper bound so oil will likely get stuck in sideways moves later in the session before EIA data release. The quick recovery from the monthly low may indicate that there is still sufficient demand at dips below the $40 mark and high volatility could be expected around this level.

