Get 40% Off
👀 👁 🧿 All eyes on Biogen, up +4,56% after posting earnings. Our AI picked it in March 2024.
Which stocks will surge next?
Unlock AI-picked Stocks

Oil Ready For A Bull Run

Published 07/30/2015, 03:27 AM
Updated 05/14/2017, 06:45 AM

Oil has found a bit of support in the market and the fundamentals are certainly helping. The recent break through the bearish trend line sets the commodity up for a strong bullish surge.

The Energy Information Agency (EIA) released their official weekly figures yesterday and that gave crude a nice boost. The result showed a draw in reserves of -4.20m barrels which is giving the market hope that the tide is turning in the oversupply of the crude oil market. Backing this up was the American Petroleum Institute (API) result earlier this week which showed a draw of -1.9m.
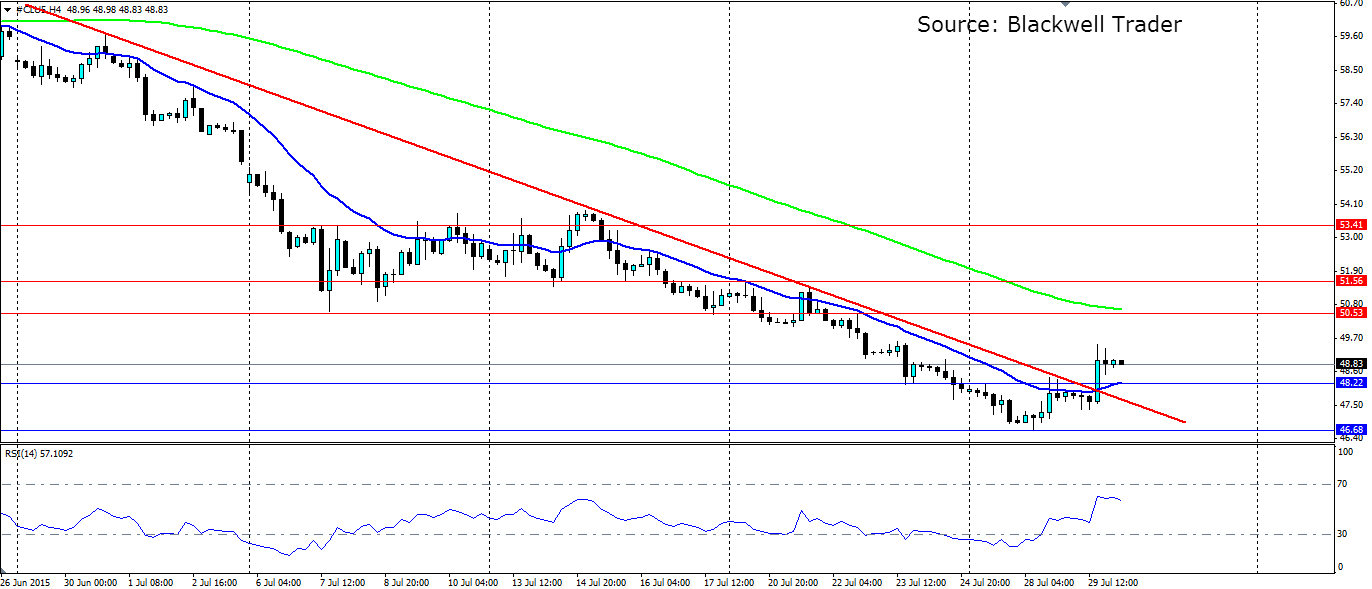
Oil 4 Hourly Chart

This has led to a sharp rise in the price of oil off the recent lows seen at the beginning of this week. WTI Crude for August delivery hit a low of $46.68 a barrel shortly before those API figures were released and has steadily climbed over the last few days to the current level of $48.89 a barrel. The good news has also helped oil to break out of the bearish trend it has been trading under.

Since late June, oil has slid from $61.50 as the bearish sentiment took hold. The trend line was tested numerous times on the way down and each time the bears defended it successfully. That was until late yesterday when the bulls won a decisive victory thanks to the EIA figures. The breakthrough came thanks to a bullish engulfing candle on the above H4 chart with a body $1.38 tall.

The RSI has followed suit with a lift out of oversold territory and a strong charge up past the 50 mark. It has tailed off slightly as the market consolidates and we may see the bears try to push it back down. In all likelihood, the 20 SMA on the H4 chart will likely act as dynamic support along with the $48.22 handle. If this level holds we can expect a solid charge higher.

3rd party Ad. Not an offer or recommendation by Investing.com. See disclosure here or remove ads .

Watch for the 100 SMA on the H4 chart to act as dynamic resistance, with 50.53, 51.56 and 53.41 all acting as resistance and target points for the leg higher. In the unlikely event that we see the bears regain control, look for the recent low at 46.68 to act as firm support.

Latest comments

Risk Disclosure: Trading in financial instruments and/or cryptocurrencies involves high risks including the risk of losing some, or all, of your investment amount, and may not be suitable for all investors. Prices of cryptocurrencies are extremely volatile and may be affected by external factors such as financial, regulatory or political events. Trading on margin increases the financial risks.
Before deciding to trade in financial instrument or cryptocurrencies you should be fully informed of the risks and costs associated with trading the financial markets, carefully consider your investment objectives, level of experience, and risk appetite, and seek professional advice where needed.
Fusion Media would like to remind you that the data contained in this website is not necessarily real-time nor accurate. The data and prices on the website are not necessarily provided by any market or exchange, but may be provided by market makers, and so prices may not be accurate and may differ from the actual price at any given market, meaning prices are indicative and not appropriate for trading purposes. Fusion Media and any provider of the data contained in this website will not accept liability for any loss or damage as a result of your trading, or your reliance on the information contained within this website.
It is prohibited to use, store, reproduce, display, modify, transmit or distribute the data contained in this website without the explicit prior written permission of Fusion Media and/or the data provider. All intellectual property rights are reserved by the providers and/or the exchange providing the data contained in this website.
Fusion Media may be compensated by the advertisers that appear on the website, based on your interaction with the advertisements or advertisers.
© 2007-2024 - Fusion Media Limited. All Rights Reserved.