Forex News and Events
US data is key
US front-end yields continue to climbing causing the overall curve to flatten as markets price in a June rate hike. U.S. 2-Year yields have reached 2016 high at 0.93%, up nearly 7bps since Friday. Fed Chair Yellen’s speech at Harvard on Friday, delivered the statement on rate hike timing, “coming months”, which has been interpreted as hawkish. Markets have quickly priced in the probablility of a rate hike by July at 75% and nearly 90% by September (which would kill our single hike in Nov/Dec opinion). Yellen has made it clear that any rate hike will be data depended making the remainder of the week’s economic release extremely critical.
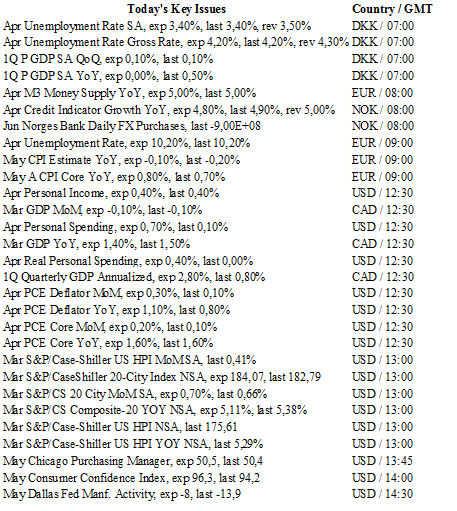
Today will provide additional clarity to the health of the US consumer. Personal income and spending is expected to have increased 0.4% m/m and 0.7% m/m (real spending 0.4%), respectively. Wage and salaries should have improved supported by the strong labor markets. On prices the PCE price index rose 0.3% m/m in April (risk to the upside) and core PCE prices rose 0.2% m/m pegging y/y read at 1.6%. Chicago PMI to be little changed at 50.5 in May, yet downside risk remain as manufacturing PMI has decelerated. Elsewhere, S&P/Case-Shiller 20-city home price index is expected to rise 0.7% m/m. Finally, Conference Board’s consumer confidence index to increase to 95.5 in the May reading, from 94.2. Overall, should the data come in-line; the outlook is good for the consumer supporting the broadest portion of the economy.
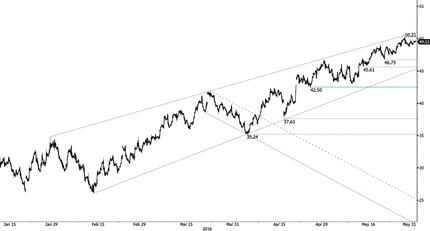
So far USD assent has been extremely orderly and sell-off in risky asset nearly imperceivable. Oil remains firm on supply concerns stemming from Nigeria and Canadian, while hype has been building around this week’s OPEC meeting. We anticipate that the closer we get to the 6th June speech by Yellen the more uncivil markets will become, especially if strong data abolishes the market’s skepticism over the Fed’s commitment to higher interest rates.
Oil prices set to boost Canadian GDP for Q1
There are certainly strong expectations today for Canada’s Q1 GDP, which will be released this early afternoon. The data is expected to come in at 2.8% y/y, higher than Q4 2015, which printed at 0.8% y/y. The rebound in oil prices is, for the most part, providing with some relief to the Canadian economy. The loonie has appreciated strongly since the start of the year, gaining more than 15 figures against the greenback. Yet, fears that the rebound in oil prices was mostly due because of short-term supply disruptions are growing and the currency is weakening as a result.
Oil prices are not the only driver of the USD/CAD pair. We believe that the Fed's monetary policy has helped to strengthen the Canadian currency for the four first months of this year as financial markets ruled out any rate hike. Now that Fed members are back on the hawkish side, the Canadian currency is heading lower. Nonetheless we believe it is temporary and we remain bullish on the Canadian dollar as the oil production should start again and increase upward pressure on the loonie and our dovish stance on the Fed leads us to think that markets may reverse, once more, to bearish US dollar.
Global uncertainties have pushed the Bank of Canada to maintain a patient stance and the central bank announced earlier last week that the overnight rate is to be kept on hold at 0.5%. Our bullish view on the Canadian dollar has to be qualified. Indeed, we consider that the Q1 data will be a small relief as the domestic environment is at stake. Business investments for example are clearly suffering. Also, natural disasters such as the recent Alberta wildfires would also clearly weigh on future revenues.

The Risk Today
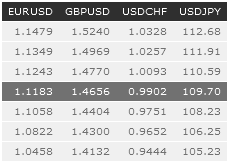
EUR/USD is heading towards 1.1100 within the downtrend channel. Hourly resistance is located at 1.1227 (24/05/2016 high) and 1.1349 (17/05/2016 high). Hourly support can be found at 1.1058 (16/03/2016 low). The technical structure suggests further downside moves within the downtrend channel. In the longer term, the technical structure favours a very long-term bearish bias as resistance at 1.1714 (24/08/2015 high) holds. The pair is trading in range since the start of 2015. Strong support is given at 1.0458 (16/03/2015 low). However, the current technical structure since last December implies a gradual increase.
GBP/USD is moving sideways in the very short-term. The pair has failed to reach hourly resistance at 1.4770 (03/05/2016 high). Hourly support is given by the lower bound of the uptrend channel and by 1.4404 (15/05/2016 low). Expected to show renewed bullish momentum toward resistance at 1.4770. The long-term technical pattern is negative and favours a further decline towards key support at 1.3503 (23/01/2009 low), as long as prices remain below the resistance at 1.5340/64 (04/11/2015 low see also the 200 day moving average). However, the general oversold conditions and the recent pick-up in buying interest pave the way for a rebound.
USD/JPY is consolidating in its way toward resistance at 110.91 (24/04/2016 high). Hourly support may be found at 108.72 (18/05/2016 low). Yet, the medium term momentum is oriented downwards and the technical structure suggests a further strong bearish move. We favour a long-term bearish bias. Support at 105.23 (15/10/2014 low) is on target. A gradual rise towards the major resistance at 135.15 (01/02/2002 high) seems now less likely. Another key support can be found at 105.23 (15/10/2014 low).
USD/CHF has broken symmetrical triangle which shows further consolidation. Hourly resistance can be found 1.0000 (psychological level) while hourly support is given at 0.9872 (26/05/2016 low). Expected to show a continued bullish move. In the long-term, the pair is still trading in range since 2011 despite some turmoil when the SNB unpegged the CHF. Key support can be found 0.8986 (30/01/2015 low). The technical structure favours a long term bullish bias since last December.

