Talking Points:
- WTI Oil nearly touched $50 on oversupplies
- Gold edged down as safe interests fade
- Copper fell to multi-week low while Shanghai shares lost
Dollar-denominated commodities continued to respond to volatility in the US dollar. The greenback fell yesterday for the first time in five days, however it picked up by Asian noon time and sent commodity prices down again.
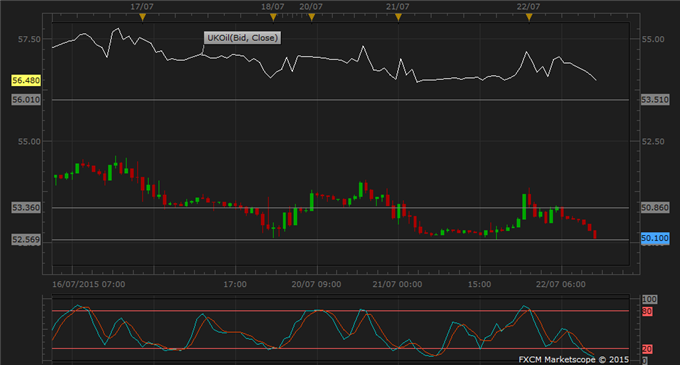
WTI crude oil has lost 1.4 percent today and traded close to $50 level as market stays focused on a supply glut. The American Petroleum Institute reported a 2.3 million barrels increase in US crude inventories last week. Outside the US, Iran’s oil minister stated that the country will focus on regaining market share regardless of the impact on prices. This affirmed an imminent oversupply amid debates on how soon and how much Iran will speed up its output. Long-term price outlook for oil remains bearish, although the $50 level may sustain in near term.
Upcoming data: EIA’s weekly report on US crude oil stockpile is expected to show a smaller decrease compare with the previous week.
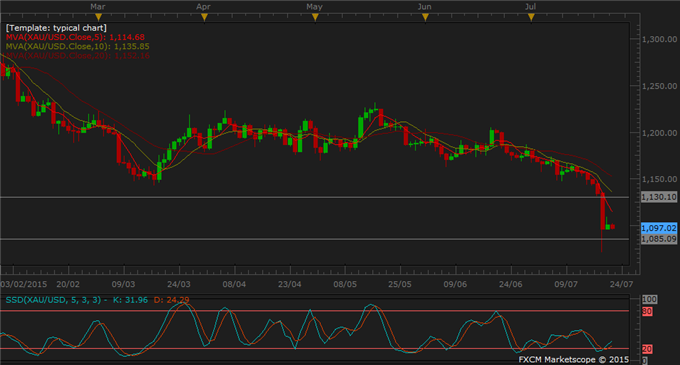
Gold failed to hold on to yesterday gain and lost 0.6 percent in the Asian morning, although it remained elevated above Monday’s multi-year low and a support level at 1085. Any rally from here would provide a chance to sell bullion while downtrend signal persists. Safe haven demand for gold has been rather muted throughout the Greek turmoil and Chinese stock slump. For its use as a reserve instrument, traditional buying from central banks has also dried up, although there is room for China to acquire more given their lower than expected reserves.
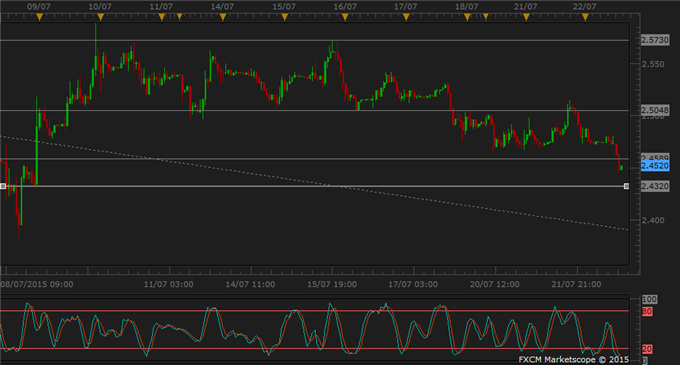
Copper fell to new multi-week low at 2.4460 near Asian noon time together with a 0.4 percent drop in the Shanghai Composite index. Reuters reported that production costs for copper have fallen due to lower oil prices and local currencies. This would likely offset a recent slide in metal prices and sustain current level of copper output. Ample supply pressures on prices while demand remains weak together with economic condition in China.
GOLD TECHNICAL ANALYSIS – Gold seems to establish a new range in the 1090s area as it recovered from Monday’s sell-off. Topside resistance level is 5-day moving average at 1114.5. Downtrend signal persists and the bears may sell any rally up to this resistance, or a previous support-turn-resistance at 1130 above head.

Daily Chart - Created Using FXCM Marketscope
COPPER TECHNICAL ANALYSIS – Copper crashed to a new multi-week low by Asian noon and a new support level comes at 2.4320. Intraday momentum signals have passed below the lower bound of range hence further decline may be limited. Any further falls in the next few sessions would bring focus back to copper May-July downtrend.

Daily Chart - Created Using FXCM Marketscope
CRUDE OIL TECHNICAL ANALYSIS – WTI oil has edged down to touch this week’s low at 50.1 ahead of a two-month support of 61.8% Fibo at 49.86. Flat momentum signals reduce chances of a break of support. Nevertheless the oil bears may position for shorts below this support level in the event of a clean break.

