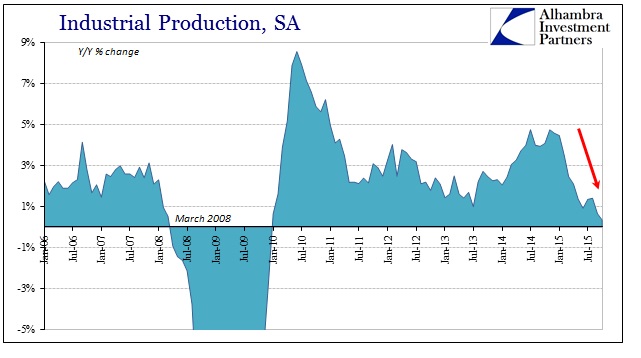
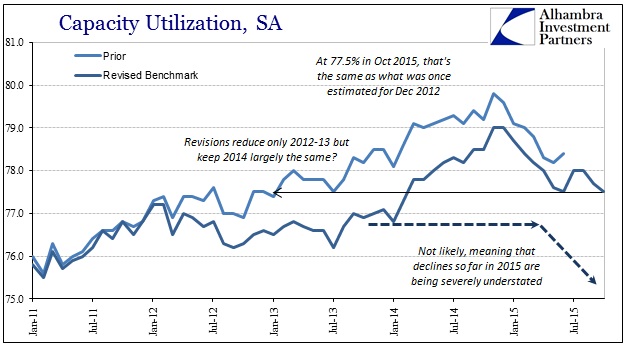
US industrial production contracted again in October, having declined now in seven out of 2015’s ten months. Year-over-year, US IP increased by the smallest amount since 2009, barely positive at just +0.34%. The last time IP was so slow was January 2010; on the way down into the Great Recession, it was equivalent to March 2008. Capacity utilization declined again to 75.5%, matching this year’s lowest point from June and confirming what has already been suggested in broad detail that the summer’s rebound was really more of variation than anything meaningful.
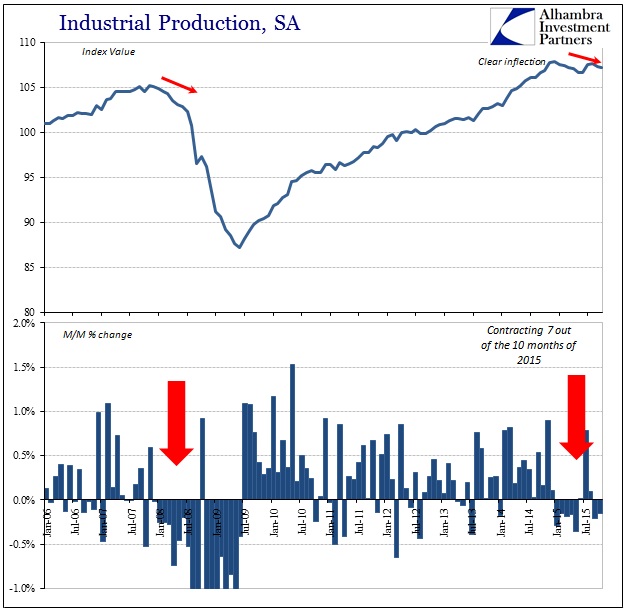
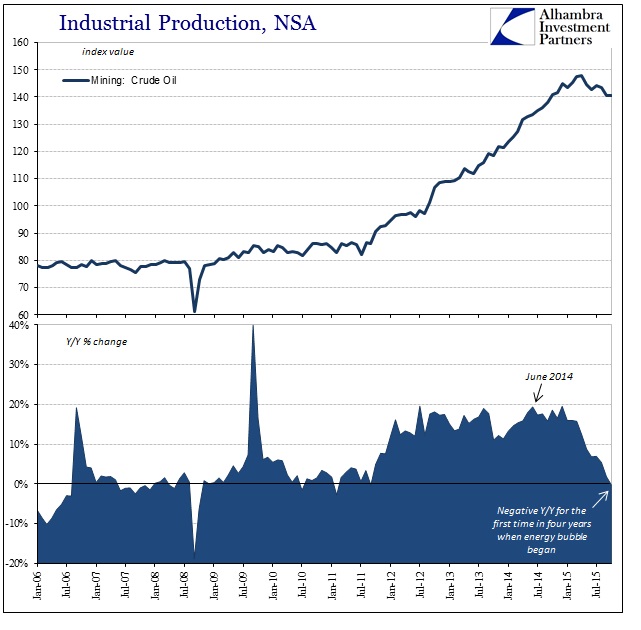
As much as Crude Oil and Natural Gas is blamed for the dramatic downturn, October represented instead the first time the oil industry has dragged down overall production year-over-year. That means that US industry itself is overall situated very much like energy production rather than oil being the exception.
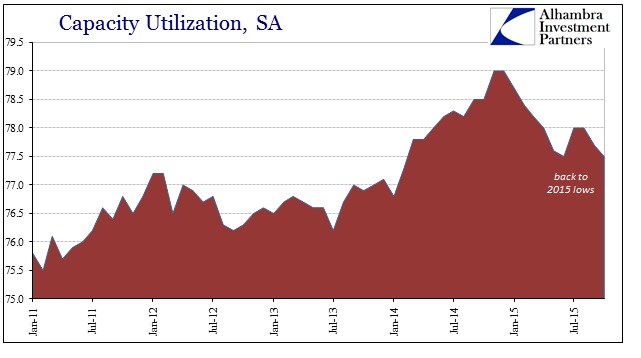
Thus, yet another “tailwind” from last year turns to an anchor. With capacity utilization at 77.5%, that represents a level of what was first estimated for December 2012 before revisions removed subjective over-estimation. The fact that these Federal Reserve estimates for capacity remained only slightly depressed after being summoned by 2012’s belatedly revealed weakness does not suggest a solid foundation for figuring how bad US industry might be strained in 2015. As with GDP and the Establishment Survey, if 2014 turns out to be nothing more than a statistical mirage, or even mostly so, a charge that only gains with every monthly economic disappointment, then we don’t really know the exact level of the contraction and recessiveness in economic activity so far.
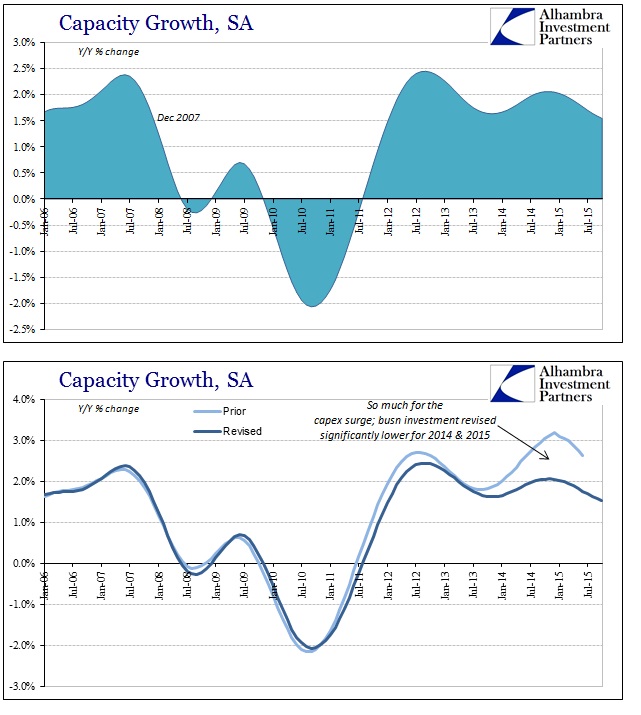
What these figures tell us is only that the US economy and industry dramatically slowed in 2015, and further that such a trend has now accumulated significant time and transactional distance without any sign of reversing. The fact that such a slowing shows up everywhere confirms the nature of it, as well as denying, unlike 2014, the possibility of statistical anomaly. Even the Fed’s estimate of capacity growth, a measure of capex, has similarly and starkly turned slower. At just 1.5%, that level is the same as we saw of December 2007.
Again, we can’t know the extent of the economic decline due to likely trend-cycle remnants, but we can be reasonably sure that it is serious and has yet to be deterred despite tracking more than ten months already. With energy production likely to be a continuous drag now from here on, that has implications beyond just a possible negative Y/Y number in total IP next month, it will be a very real depression in the real economy. If the energy bubble, made so by its debt-based junk foundation, was a cushion against the 2012 slowdown, its absence will very likely be noticeable especially as the rest of the consumer economy falls apart already on its own.
