Get 40% Off
🚨 Volatile Markets? Find Hidden Gems for Serious OutperformanceFind Stocks Now

Oil And Gold Analysis: Gold Rebounded From Four Month Low

Published 11/27/2013, 03:15 AM
Updated 04/25/2018, 04:40 AM

CL
Crude declined for a third day in New York on projections that U.S. crude inventories advanced for a 10th week. WTI declined in the six weeks through Nov. 15, the longest losing streak in 15 years, as U.S. crude inventories expanded amid a surge in production. Stockpiles have risen to 388.5 million barrels, the most since June, according to the EIA, the Energy Department’s statistical arm. Supplies rose 750,000 barrels last week, before an Energy Information Administration report. U.S. crude fell 0.4 percent. To 93.40.
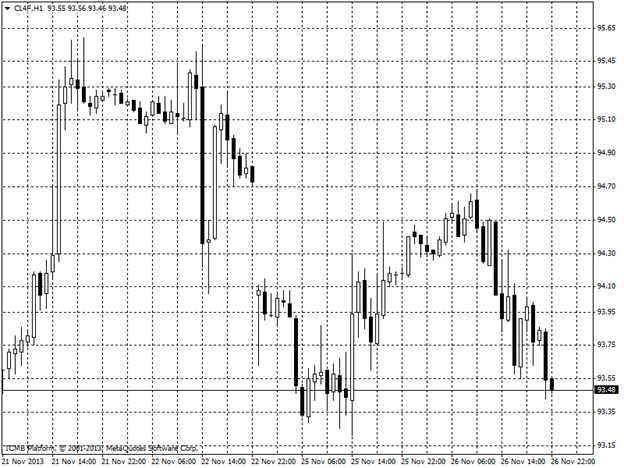
Oil Hour Chart

GOLD
Gold rebounded from a four-month low to the highest level in almost a week as the dollar weakened and lower prices spurred demand in China, the second-largest consumer, countering outflows from exchange-traded products. ,gold rose as much as 0.6 percent to $1,258.30 an ounce, the highest level since Nov. 20 Gold tumbled 25 percent this year, entering a bear market in April. Investors sold metal from ETPs at a record pace as inflation failed to accelerate and on expectations the Federal Reserve will begin scaling back its $85 billion-a-month of asset purchases that helped bullion cap a 12-year bull run in 2012.
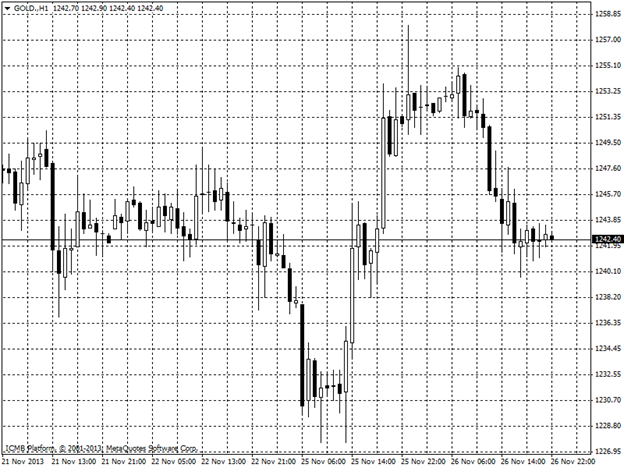
Gold Hour Chart

Latest comments

Risk Disclosure: Trading in financial instruments and/or cryptocurrencies involves high risks including the risk of losing some, or all, of your investment amount, and may not be suitable for all investors. Prices of cryptocurrencies are extremely volatile and may be affected by external factors such as financial, regulatory or political events. Trading on margin increases the financial risks.
Before deciding to trade in financial instrument or cryptocurrencies you should be fully informed of the risks and costs associated with trading the financial markets, carefully consider your investment objectives, level of experience, and risk appetite, and seek professional advice where needed.
Fusion Media would like to remind you that the data contained in this website is not necessarily real-time nor accurate. The data and prices on the website are not necessarily provided by any market or exchange, but may be provided by market makers, and so prices may not be accurate and may differ from the actual price at any given market, meaning prices are indicative and not appropriate for trading purposes. Fusion Media and any provider of the data contained in this website will not accept liability for any loss or damage as a result of your trading, or your reliance on the information contained within this website.
It is prohibited to use, store, reproduce, display, modify, transmit or distribute the data contained in this website without the explicit prior written permission of Fusion Media and/or the data provider. All intellectual property rights are reserved by the providers and/or the exchange providing the data contained in this website.
Fusion Media may be compensated by the advertisers that appear on the website, based on your interaction with the advertisements or advertisers.
© 2007-2024 - Fusion Media Limited. All Rights Reserved.