
Oil prices have been in the spotlight as the Syrian chemical weapons crisis became front and center in the media. As the political process has unfolded, price volatility in oil futures in both directions has been extreme. Oil prices have traded in a wide range the past two weeks between $104 – $112 dollars per barrel.
Implied Volatility
As a professional option trader, I wanted to look at what the implied volatility within options on oil futures was saying about future oil prices. The oil futures option chain would give me some possible clues about near and intermediate term price direction.
I am constantly focused on implied volatility. I regularly look for stocks or futures that are showing implied volatility levels which are higher than their historical average. The very first thing I look at is the implied volatility skew across multiple option chains with different expiration dates.
As such, when I looked at the oil futures option chains I noticed that the longer dated expirations had a slightly higher than normal implied volatility. It is normal for the longer dated expirations to have higher volatility levels, but what was striking to me was the implied volatility in December was not much higher in the December oil futures options than what it is in the front month expiration. I found this odd so I looked at the spot oil futures prices going out in time. The following chart comes directly from www.cmegroup.com.
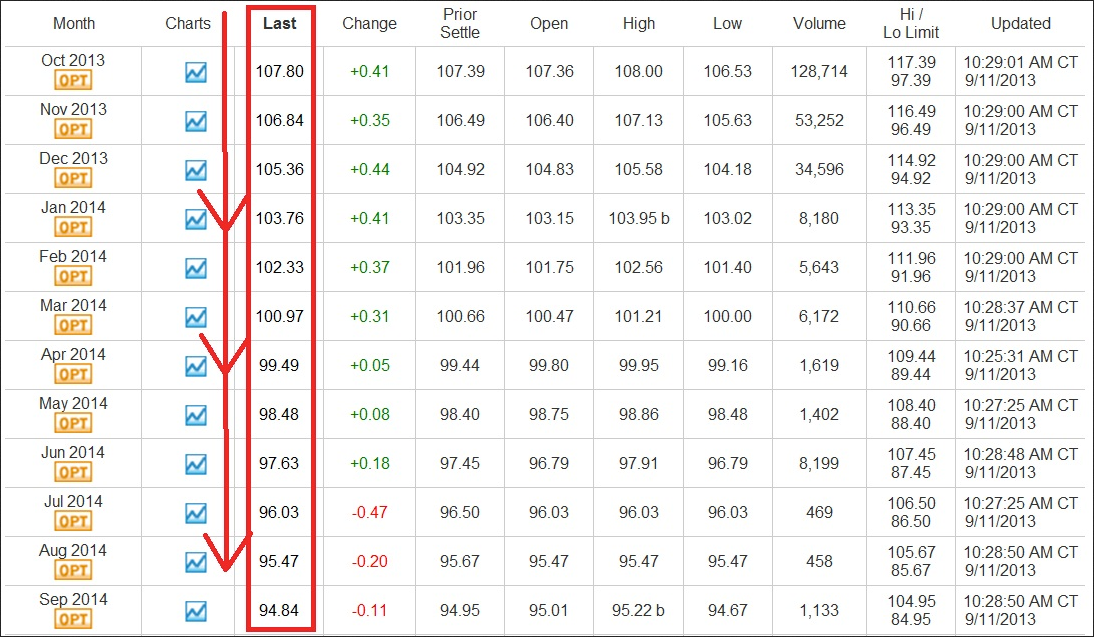
As can be seen, as you move out further in time the oil futures prices decline. This is a condition in the oil futures market known as backwardation.
According To Goldman:
This rise in backwardation in oil, in our view, is not driven by the events in Syria, but rather by increasingly tighter fundamentals that are a result of the production shortfalls in Libya and Iraq against improving Chinese demand.
Essentially Goldman Sachs’ analysts go on to say that they believe oil prices will see modest declines over the next 12 months, but the backwardation will likely lead to returns being mostly flat over the next year.
The fundamental backdrop according to Goldman Sachs appears to be bullish in the short-term based on supply data. Unfortunately fundamentals usually explain why an underlying asset moved the way it did after the fact. Making money in the short term as a trader is difficult when basing entry and exit decisions solely on fundamentals.
With the fundamental backdrop explained, I thought it would make sense to look at key technical levels in the oil futures price chart. The chart below illustrates key price levels based on recent price action in oil.
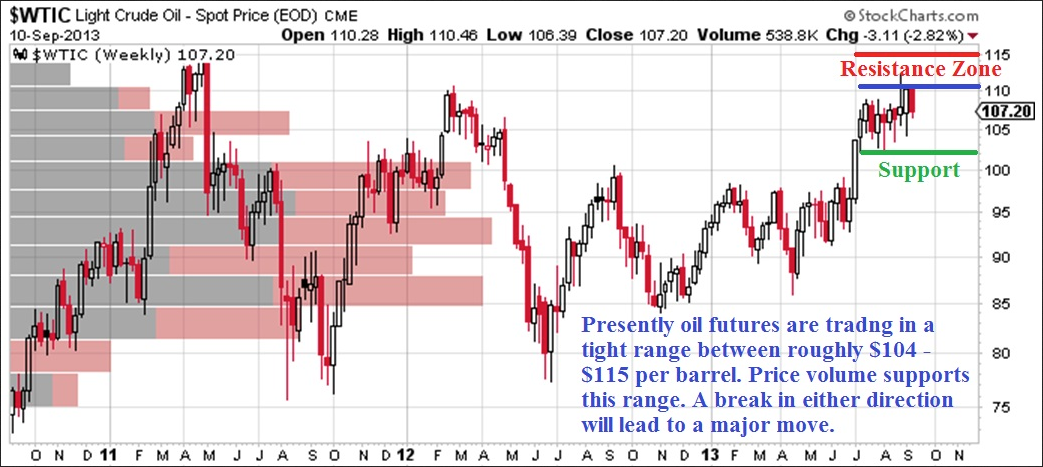
Obviously the consolidation zone is setting up for a large move in oil prices. The more important question to answer is which direction will oil prices move? Will we see activity or supply data that pushes prices above the resistance zone? Under that scenario, the next logical price target for oil would be between $121 – $130 per barrel.
Probability-Based Support And Resistance
If prices reverse course and break below support, we should see strong buyers come in around the $90 – $95 per barrel price zone. At this point, the next stage in my analysis is going to be probability-based support and resistance for oil futures.
This process has to do with calculations involving implied volatility to derive a probability based on price action today. Clearly those probabilities change constantly, but the probability data set is accurate in real time or at the time of entry.
Traditionally I will use standard deviations to help determine price ranges as well as setting up trades that are directional such as credit or debit spreads. Other times I will use standard deviations to place credit spreads like Iron condors which focus more on the passage of time and are generally more agnostic to price action.
One standard deviation is typically calculated as 68%. Based on the options on oil futures which expire in 36 days on October 18, a one standard deviation move would place oil prices around $103 per barrel to the downside. A one standard deviation move to the upside based on Wednesday’s closing prices would put oil prices around $110 per barrel.
Interestingly enough, the price range expectations for a one standard deviation move from current prices today (09/11) at the close fits precisely into the price range discussed above using technical analysis.
Varying data lining up like this does not always happen this precisely, however when key price levels line up in this manner it should not be ignored. The option data is basically indicating that there is a better than 68% probability that in 36 days the price of oil will be in the $103 – $110 per barrel price range.
The oil futures price chart shown below illustrates a two standard deviation move. The lines drawn on the chart below demonstrate the next key price levels should a 2-standard deviation move occur from the current price at the October option expiration.
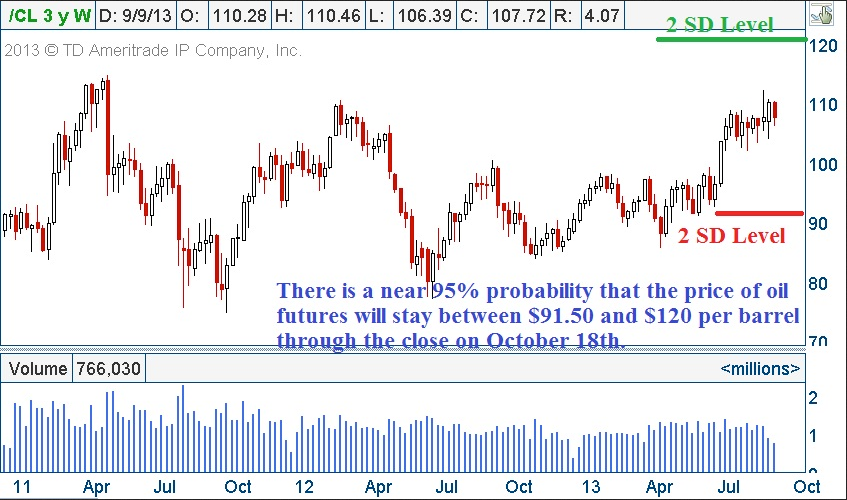
It is important to understand that there is roughly a 10% probability that oil will even touch either key price level shown above before the October-18 expiration. So what do all of these probability calculations tell us?
Right now, the implied volatility in the options that expire on October 18, 2013 based on current oil futures spot prices has a low probability of seeing a surge higher or a major move lower. The option data essentially concurs with Goldman Sachs fundamental view that oil prices are likely to stay in a trading range and probabilities do not favor a big unexpected move.
I would point out however, that the probabilities for a big move are not 0%. There is a 1 in 10 chance that we see a big surge or breakdown in price. As far as I am concerned, this is the option markets calculated odds on any major escalation taking place in Syria or the Middle East prior to October 18, 2013.
Short-Term Pricing
I think in the short-term we could see oil futures prices move up toward $115/barrel. However, the probabilities simply do not favor a prolonged move above that level. Furthermore, it seems likely that when the Syrian debacle concludes that prices will be more likely to be in the $103 – $110 price range in roughly one month.
Instead of reading articles written by pundits who are making price projections based on an educated guess, why not let the options market be a guide for where the marketplace is pricing in the next move. The analysts that are calling for a monster move in oil in the near term have roughly a 10% probability of being right. I will let readers decide whether a pundit or the option pricing in oil futures is likely to be more accurate.
Implied Volatility
As a professional option trader, I wanted to look at what the implied volatility within options on oil futures was saying about future oil prices. The oil futures option chain would give me some possible clues about near and intermediate term price direction.
I am constantly focused on implied volatility. I regularly look for stocks or futures that are showing implied volatility levels which are higher than their historical average. The very first thing I look at is the implied volatility skew across multiple option chains with different expiration dates.
As such, when I looked at the oil futures option chains I noticed that the longer dated expirations had a slightly higher than normal implied volatility. It is normal for the longer dated expirations to have higher volatility levels, but what was striking to me was the implied volatility in December was not much higher in the December oil futures options than what it is in the front month expiration. I found this odd so I looked at the spot oil futures prices going out in time. The following chart comes directly from www.cmegroup.com.
As can be seen, as you move out further in time the oil futures prices decline. This is a condition in the oil futures market known as backwardation.
According To Goldman:
This rise in backwardation in oil, in our view, is not driven by the events in Syria, but rather by increasingly tighter fundamentals that are a result of the production shortfalls in Libya and Iraq against improving Chinese demand.
Essentially Goldman Sachs’ analysts go on to say that they believe oil prices will see modest declines over the next 12 months, but the backwardation will likely lead to returns being mostly flat over the next year.
The fundamental backdrop according to Goldman Sachs appears to be bullish in the short-term based on supply data. Unfortunately fundamentals usually explain why an underlying asset moved the way it did after the fact. Making money in the short term as a trader is difficult when basing entry and exit decisions solely on fundamentals.
With the fundamental backdrop explained, I thought it would make sense to look at key technical levels in the oil futures price chart. The chart below illustrates key price levels based on recent price action in oil.
Obviously the consolidation zone is setting up for a large move in oil prices. The more important question to answer is which direction will oil prices move? Will we see activity or supply data that pushes prices above the resistance zone? Under that scenario, the next logical price target for oil would be between $121 – $130 per barrel.
Probability-Based Support And Resistance
If prices reverse course and break below support, we should see strong buyers come in around the $90 – $95 per barrel price zone. At this point, the next stage in my analysis is going to be probability-based support and resistance for oil futures.
This process has to do with calculations involving implied volatility to derive a probability based on price action today. Clearly those probabilities change constantly, but the probability data set is accurate in real time or at the time of entry.
Traditionally I will use standard deviations to help determine price ranges as well as setting up trades that are directional such as credit or debit spreads. Other times I will use standard deviations to place credit spreads like Iron condors which focus more on the passage of time and are generally more agnostic to price action.
One standard deviation is typically calculated as 68%. Based on the options on oil futures which expire in 36 days on October 18, a one standard deviation move would place oil prices around $103 per barrel to the downside. A one standard deviation move to the upside based on Wednesday’s closing prices would put oil prices around $110 per barrel.
Interestingly enough, the price range expectations for a one standard deviation move from current prices today (09/11) at the close fits precisely into the price range discussed above using technical analysis.
Varying data lining up like this does not always happen this precisely, however when key price levels line up in this manner it should not be ignored. The option data is basically indicating that there is a better than 68% probability that in 36 days the price of oil will be in the $103 – $110 per barrel price range.
The oil futures price chart shown below illustrates a two standard deviation move. The lines drawn on the chart below demonstrate the next key price levels should a 2-standard deviation move occur from the current price at the October option expiration.
It is important to understand that there is roughly a 10% probability that oil will even touch either key price level shown above before the October-18 expiration. So what do all of these probability calculations tell us?
Right now, the implied volatility in the options that expire on October 18, 2013 based on current oil futures spot prices has a low probability of seeing a surge higher or a major move lower. The option data essentially concurs with Goldman Sachs fundamental view that oil prices are likely to stay in a trading range and probabilities do not favor a big unexpected move.
I would point out however, that the probabilities for a big move are not 0%. There is a 1 in 10 chance that we see a big surge or breakdown in price. As far as I am concerned, this is the option markets calculated odds on any major escalation taking place in Syria or the Middle East prior to October 18, 2013.
Short-Term Pricing
I think in the short-term we could see oil futures prices move up toward $115/barrel. However, the probabilities simply do not favor a prolonged move above that level. Furthermore, it seems likely that when the Syrian debacle concludes that prices will be more likely to be in the $103 – $110 price range in roughly one month.
Instead of reading articles written by pundits who are making price projections based on an educated guess, why not let the options market be a guide for where the marketplace is pricing in the next move. The analysts that are calling for a monster move in oil in the near term have roughly a 10% probability of being right. I will let readers decide whether a pundit or the option pricing in oil futures is likely to be more accurate.