Talking Points:
- China market closes, ECB meets on monetary policy Thursday, US Non-farm Payrolls Friday
- Gold held loss as stocks recovered, stayed dormant before NFP
- Oil steadied after extreme volatility following large output rise and equity rebound
- Copper sustained gains in thin market, though supply aplenty
Commodities posted early losses as US dollar firmed up in anticipation of a slightly-dovish European Central Bank meeting today and solid Non-farm Payrolls data tomorrow, although they quickly recouped the losses given thin market in Asia. U.S. employment and factory data came out on the soft side, although the economy hired more workers last month than in July, and second quarter productivity rose more than estimated.
Gold held losses and has stayed dormant since the New York afternoon, as stock markets recovered and investors shifted to wait-and-see mode prior to US employment data. ECB’s meeting today will likely make little difference to gold prices unless Draghi’s message translates to notable moves in equities and risk assets.
Gold prices at five-year low have resuscitated demand, as the Financial Times reported tentative demands from China and India. Data from the World Gold Council also showed China has gradually increased its gold reserve.
Oil stabilized in Asia after extreme volatility overnight, including a price slump to $43.21 due to large US inventory rise in EIA’s report, then a rise to $46.77 as equities rebounded and EIA’s new survey method revealed the first-half output was revised downward by 130,000 barrels a day.
With a crowded economic calendar for the rest of this week, oil may face heightened deviations again as the market take into consideration abundant supply, signs of economic pick-up, and movements in the US dollar.
As we noticed in past reports, copper has formed positive correlation with equities, perhaps as a sign of economic growth. The metal rose consistently throughout yesterday together with gains in US stocks, decent US data, and a rally of industrial metals led by tin after Indonesia (the world’s largest tin supplier) reinstated a ban on ore exports.
Today copper has swung around together with other commodities in a thin market while China closes for Victory Day celebration. Bearish momentum prevails in copper as demand remains uncertain while supply seems aplenty. Warehouse stockpiles monitored by COMEX consistently posted increases for the last several days.
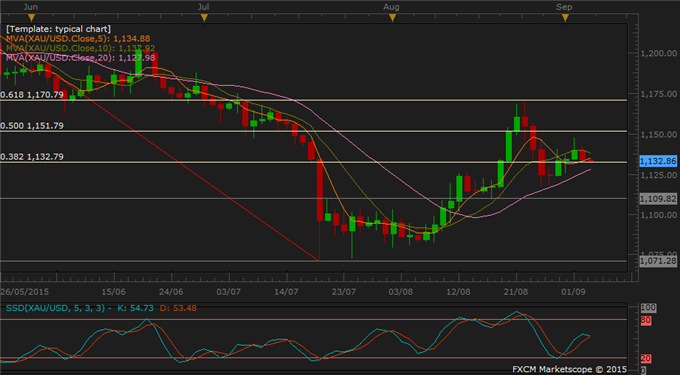
GOLD TECHNICAL ANALYSIS – Gold continued to edge up in line with the 20-day moving average, which acted as a support level, last seen at 1127.8. This is a tad lower than the 38.2% Fibo. Weak daily momentum is still biased to the upside, although higher extensions look rather limited given mixed moving averages and firm resistance levels at 50% Fibo, then 62.8 % Fibo above head. Gold bulls should watch these Fibo’s for clues to take profit or place more longs.

Daily Chart - Created Using FXCM Marketscope
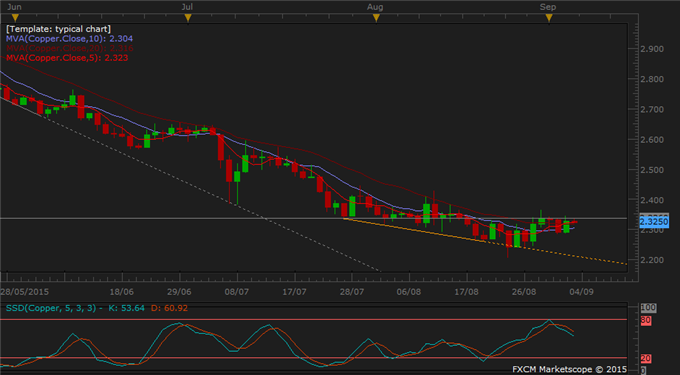
COPPER TECHNICAL ANALYSIS – Copper lingers below a weekly resistance level at 2.3360 in sideways fashion for a fifth day, amid mixed signals. Momentum indicators point to downside, whereas moving averages indicate that the downtrend has finished and copper is now in a correction. There is little sign for further upside, so the bulls should stay extremely cautious. The bears may find this correction going for longer than desirable, at least until China market opens again next week.

Daily Chart - Created Using FXCM Marketscope
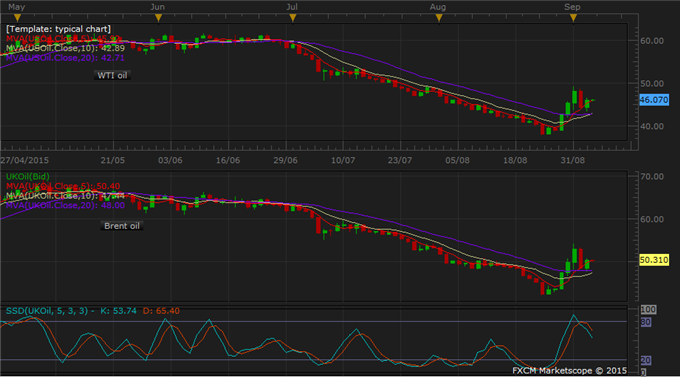
CRUDE OIL TECHNICAL ANALYSIS – After volatility rose to near record high during New York session, oil stabilised in Asia with a light upside bias. However, topside seems limited as long term momentum still points to downside, and oil’s weekly chart faces a strong resistance level at 50% Fibo at 49.76. A firm daily support is found at 20-day moving average, at 42.72 for WTI and 48 for Brent. Any upcoming rally would provide opportunity for the bears to sell some more.

