
Kiwi Dollar suffered slight pullback this morning but uptrend remained intact. Considering that Asian stocks are mixed, it is not surprising to see "risk currencies" like NZD/USD a little bit softer especially after a tremendous bullish push yesterday which sent prices to yet new highs. Certainly there is cause for concern as current decline is actually the largest amongst all the major risk currencies such as EUR/USD, GBP/USD and more worrying neighbor AUD/USD which is supposed to be more bearish compared to NZD/USD. However, with prices staying above the previous record high for now, bearish pressure isn't overwhelming and we can ignore the relatively more aggressive bearish pullback as a natural respond seeing that prices have gained the most as well yesterday.
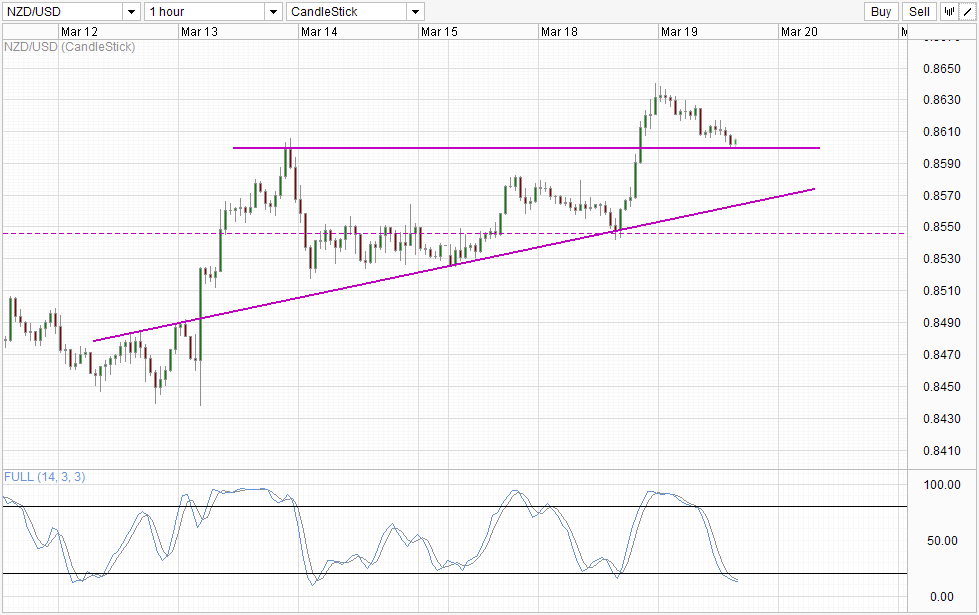
Hourly Chart
 NZD/USD Hourly" title="NZD/USD Hourly" height="242" width="474">
From a technical perspective, the likelihood of 0.860 is good as Stochastic indicator is already tapering flat and is threatening to reverse higher soon. Also, even if 0.86 fails, prices will be able to find further support from the rising trendline failing which the 0.8545 support (seen on Daily Chart). Hence, uptrend will remain intact unless there is a significant bearish shift in sentiment and/or fundamentals/global development which is unlikely to happen in the next 10 hours with FOMC Rate Decision and Kiwi GDP numbers looming.
Nonetheless, should FOMC and/or Kiwi GDP figures turned out bearish, bullish strength will be confirmed if overall bullish trend remains intact (e.g. no break of 0.8545 support), and we can expect prices to recover back towards 0.86 and higher especially if broad risk sentiment is bullish as well.
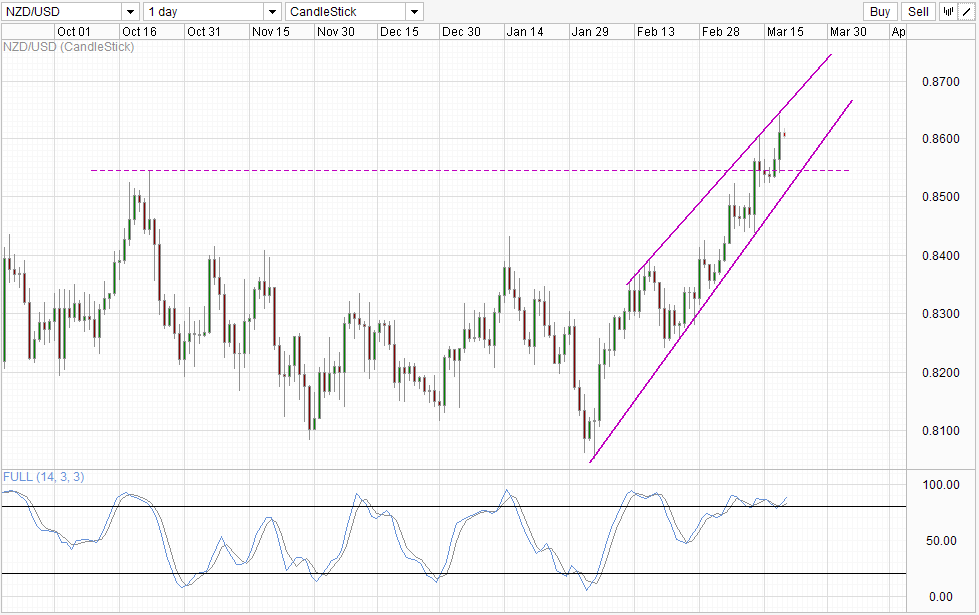
Daily Chart
 NZD/USD Daily" title="NZD/USD Daily" height="242" width="474">
Daily Chart shows a bullish breakout that has been affirmed with the holding of 0.8445 resistance turned support. However, bullish momentum has been going on without any significant bearish pullback, and we may be overdue for one - a notion that is seconded by Stochastic indicator with Stoch curve staying within the Overbought region for an extended period of time. That being said, the risk of any sell-off is also low, echoing what was said about Short-Term analysis above as both signal and stoch curve are pointing higher after rebounding off the 80.0 level at the same time when the breakout of 0.8445 was confirmed. The ability to avoid the bearish cycle signal suggest that bullish momentum is still strong for now, and even though we could still see some slight short-term bearish reversion but prices is certainly not topping yet.