Forex News and Events
Kiwi surges on trade figures
In spite of the strong likelihood of a RBNZ rate cut, traders turned bullish on the Kiwi amid encouraging trade figures. Data showed that the year-to-year trade deficit narrowed to NZ$3.13bn in June from NZ$3.62bn in the previous month as exports fell less than expected to 4.26bn, (versus 4.22bn consensus) from 4.56bn in the previous month. On a seasonally adjusted basis, good exports rose 5.8%q/q in the June quarter, boosted by record export figures of Kiwi fruit, which rose 23%q/q (or 30%y/y) in the second quarter to NZ$1.44bn. On the other hand, good imports rose 0.5%q/q.
These impressive figures from the fruit industry somehow offset the lacklustre figures from the dairy sector - exports for which have dropped massively (-4.5%q/q or -7.3%y/y) as dairy prices collapse.
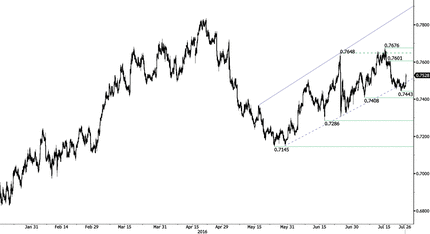
The New Zealand dollar rose to 0.7060 against the greenback as traders reloaded long NZD positions. In our opinion, there is still downside potential for the Kiwi as the RBNZ will almost surely cut rates in August. However, given the relatively sustainable positive risk environment and investors’ appetite for return, we believe the Kiwi’s downside potential is limited. For now, NZD/USD continues to trade with a solid positive momentum as it has done since the beginning of the year. A break of the $0.69 support would most likely trigger further debasement.
Stay short USD
The July FOMC meeting gets under way today with limited expectations. We expect policy to remain unchanged and that any adjustment to language will be minimal (acknowledgement of the improvement in the US economy due to a strong recovery in labor markets). Regardless of thinking, FOMC members will not signal a potential rate hike at the September meeting. This will most likely occur at the August FOMC policy meeting when members have additional economic data (including the 2Q GDP report after Yellen’s Jackson Hole appearance) and a better appreciation of the extent to which Brexit has affected the global outlook.
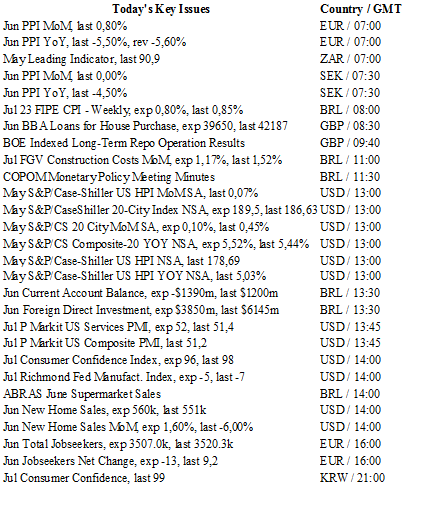
Today, US PMI and consumer confidence reads should take a bit of the wind out of the September hike argument as both indicators are expected to weaken. However, New Home Sales positive trend should continue to improve (560 exp vs. 551 prior read). The housing sector remains a bullish portion of the US economic perhaps clouding some of the weaker elements, specifically surrounding the consumer. By some estimates, 2Q GDP growth could reach 2.5% based on the strong consumer offsetting softness in business and energy investments. However, consumption has been led by residential investment and auto sales, both artificially financed by cheap lending, and therefore unsustainable.
Our base scenario is for a distant single hike in Nov/Dec, so any USD bounce should be viewed as short term and an opportunity to reload short USD positions.
AUD/USD - Sharp rally. 

The Risk Today
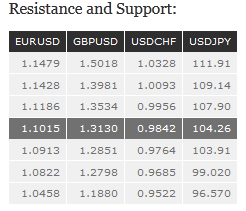
EUR/USD is pushing lower, below 1.1000, indicating a persistent short-term selling interest. Hourly support lies at 1.0913 (06/07/2016 low) while hourly resistance is located at 1.1186 (05/07/2016 high). Stronger resistance is given at 1.1428 (23/06/2016 high). In the longer term, the technical structure favours a very long-term bearish bias as resistance at 1.1714 (24/08/2015 high) holds. The pair is trading in range since the start of 2015. Strong support is given at 1.0458 (16/03/2015 low). However, the current technical structure since last December implies a gradual increase.
GBP/USD has bounced near the support at 1.2882, yet, buying pressures quickly faded. Expected to break lower symmetrical triangle, targeting support at 1.2798 (06/07/2016 low). Hourly resistance is located at 1.3291 (22/07/2016 high). Stronger resistance is located at 1.3534 (29/06/2016 high). The long-term technical pattern is negative and favours a further decline as long as prices remain below the resistance at 1.5340/64 (04/11/2015 low see also the 200-day moving average). Key support at 1.3503 (23/01/2009 low) has been broken and the road is wide open for further decline.
USD/JPY has bounced on and off within short-term uptrend channel. Hourly supports are located at 105.42 (intraday low) and at 103.91 (13/07/2016 low). Resistance is located at 107.90 (07/06/2016 high). Expected to break lower short-term channel. We favour a long-term bearish bias. Support is now given at 96.57 (10/08/2013 low). A gradual rise towards the major resistance at 135.15 (01/02/2002 high) seems absolutely unlikely. Expected to decline further support at 93.79 (13/06/2013 low).
USD/CHF continues to post higher lows, indicating a persistent short-term buying interest. However, given the resistance area between 0.9949 and 1.0328, the upside potential seems limited. Hourly support at 0.9853 (07/21/2016 low) and 0.9764 (14/07/2016 high). Hourly resistance is given at 0.9907 (21/07/2016 high). In the long-term, the pair is still trading in range since 2011 despite some turmoil when the SNB unpegged the CHF. Key support can be found 0.8986 (30/01/2015 low). The technical structure favours a long term bullish bias since last December.

