Get 40% Off
🚨 Volatile Markets? Find Hidden Gems for Serious OutperformanceFind Stocks Now

NQ Emini Leading From The Back

Published 06/20/2016, 03:34 AM
Updated 07/09/2023, 06:31 AM

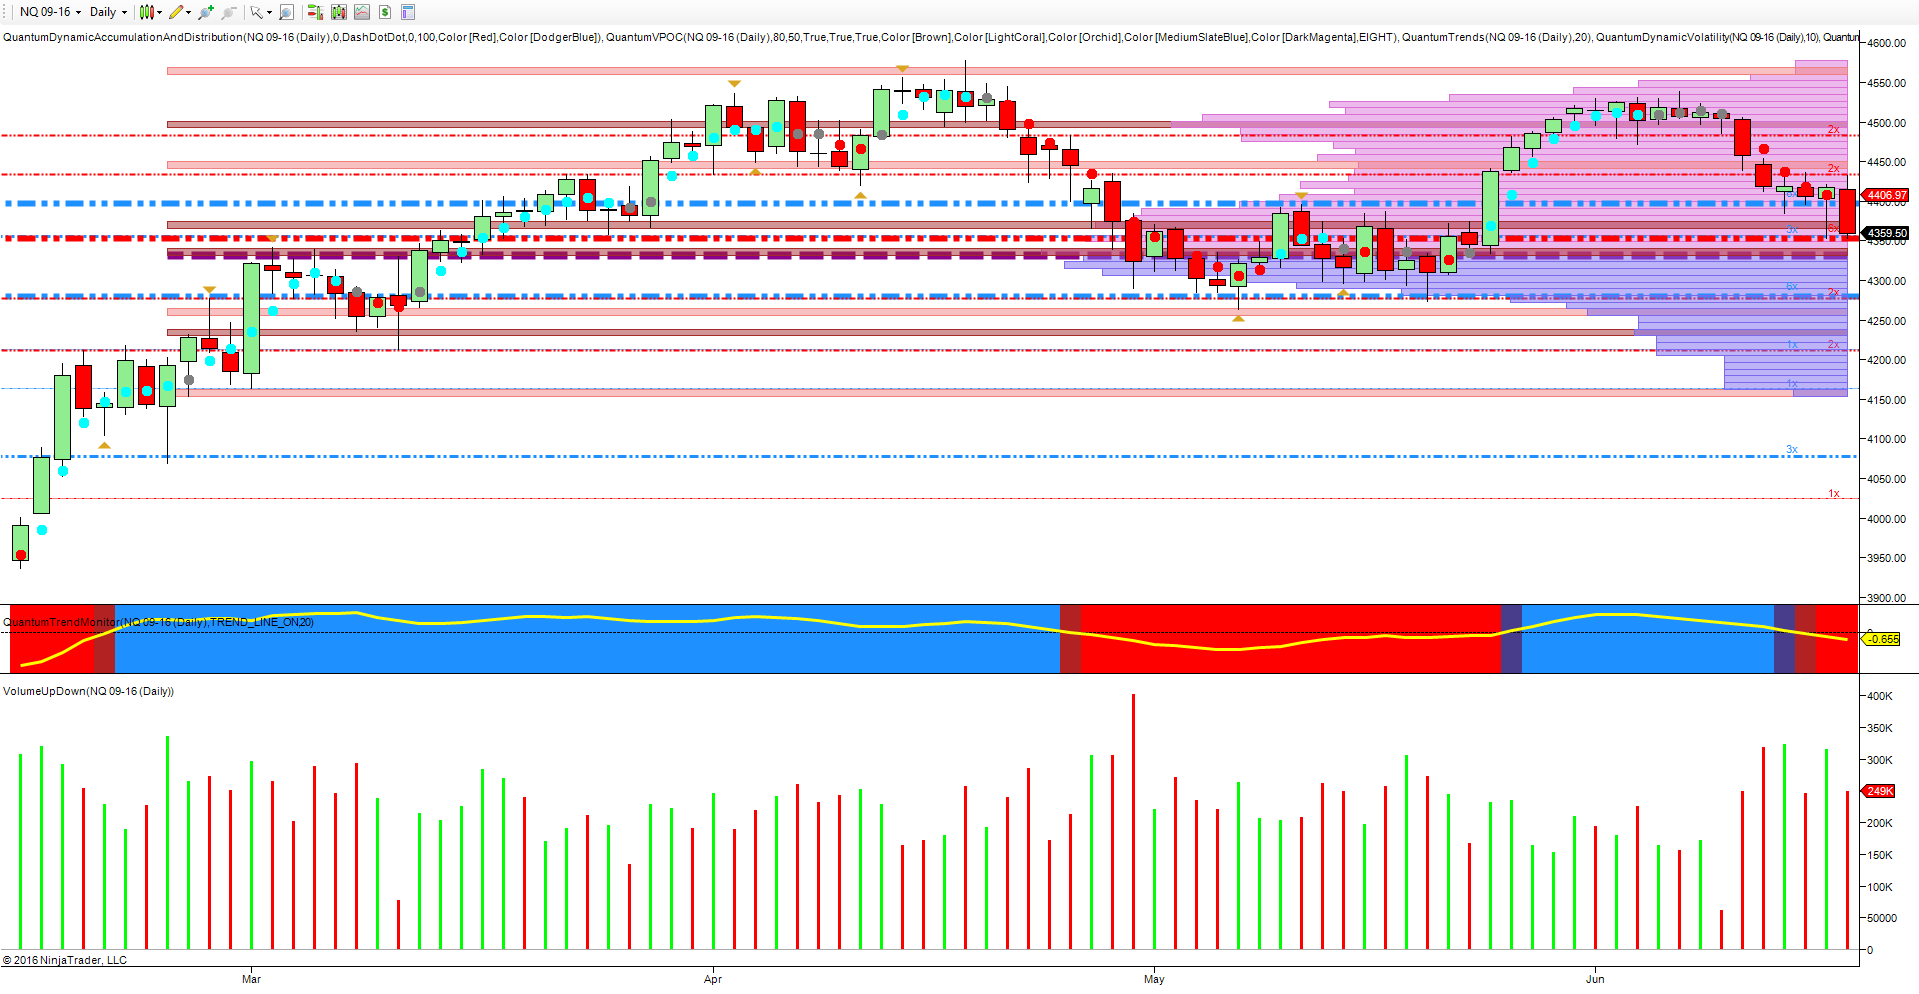
NQ Daily Chart

The short term weakness we have seen over the last week in the US markets, was once again signalled on the NQ emini, which seems to have adopted the role of the leading laggard. The self evident weakness of late May, duly delivered a rollover in June as the exhaustion point of the rally was finally reached.

The catenary price action formed in the move higher was a classic example of price action weakness, with ever narrowing spreads as the index attempted to crawl higher, with the associated volume falling away in tandem. The ceiling of price action had been established in the 4520 area, and it was only a question of time before the index capitulated and rolled over.

This occurred last week with Friday’s price action breaching the 4400 area and closing the week at 4359.50 with a test of the support region now coming into play at this level. Once again, it is the NQ emini which is leading from behind, and the clear lack of bullish intent was evident on the index, and also reflected on the ES and YM accordingly.

With the US economy allegedly emerging from recession, it is strange to see the NQ behaving in this odd way. Nevertheless, this appears to be its new role, leading from behind, and indeed this was also the case in the recent rally. The NQ emini lagged well behind the other two indices, both of which broke out above old resistance regions, outpacing the NQ in percentage rally terms.

3rd party Ad. Not an offer or recommendation by Investing.com. See disclosure here or remove ads .

With the index now approaching the volume point of control at 4340 and given the depth of price congestion now awaiting in this region, we are likely to see further consolidation between 4300 and 4400 – Brexit notwithstanding!

Latest comments

Risk Disclosure: Trading in financial instruments and/or cryptocurrencies involves high risks including the risk of losing some, or all, of your investment amount, and may not be suitable for all investors. Prices of cryptocurrencies are extremely volatile and may be affected by external factors such as financial, regulatory or political events. Trading on margin increases the financial risks.
Before deciding to trade in financial instrument or cryptocurrencies you should be fully informed of the risks and costs associated with trading the financial markets, carefully consider your investment objectives, level of experience, and risk appetite, and seek professional advice where needed.
Fusion Media would like to remind you that the data contained in this website is not necessarily real-time nor accurate. The data and prices on the website are not necessarily provided by any market or exchange, but may be provided by market makers, and so prices may not be accurate and may differ from the actual price at any given market, meaning prices are indicative and not appropriate for trading purposes. Fusion Media and any provider of the data contained in this website will not accept liability for any loss or damage as a result of your trading, or your reliance on the information contained within this website.
It is prohibited to use, store, reproduce, display, modify, transmit or distribute the data contained in this website without the explicit prior written permission of Fusion Media and/or the data provider. All intellectual property rights are reserved by the providers and/or the exchange providing the data contained in this website.
Fusion Media may be compensated by the advertisers that appear on the website, based on your interaction with the advertisements or advertisers.
© 2007-2024 - Fusion Media Limited. All Rights Reserved.