The global weather pattern El Nino can become one of major factors driving the volatility in agricultural commodity markets in coming months. El Nino weather pattern, which arises as Pacific Ocean sea surface temperatures rise above normal levels and change regular wind patterns causing draughts and floods, can severely impact crop harvests around the globe.
El Nino conditions are present and El Nino will likely peak during the Northern Hemisphere winter 2015/16 and weather conditions will transition to neutral during the late spring or early summer 2016, according to US National Oceanic and Atmospheric Administration. And World Meteorological Organization expects this El Nino will be the biggest in more than 15 years.
Australia, the world’s largest wheat exporter, cut its crop outlook by 5.2% for the 20015/16 season ending in July 1, 2016 to 23.98 million tonnes from its previous estimate in September of 25.28 million tonnes due to dry weather, frost and fire damage. However, wheat crop is expected to exceed marginally last season’s output.
Low rainfall and drought have resulted in poor harvests in Africa and Central America, particularly in Ethiopia, Malawi, Guatemala, El Salvador, Honduras and Nicaragua, along with Haiti and southeastern Brazil, resulting in higher food prices due to widespread damage to crops. World Food Program of UN estimates 13.1 million people in East Africa and Central America will need food assistance because of crop failures and higher food prices.
Dry weather can significantly reduce the coffee output in No. 2 robusta producer Brazil and No. 3 producer Indonesia. The drought over Espirito Santo, Brazil’s leading robusta growing state, may cause a reduction in robusta output to 10.85 million 60-kg bags in 2015/16, from 13.04 million last year, according to Brazil’s Agriculture Ministry mid-November estimate. The Association of Indonesian Coffee Exporters and Industries estimate at the same time indicated production could drop to 5.8-6 million 60-kg bags in 2016 from 6.7 million in 2015, depending on the severity of El Nino. Experts mention the impact on coffee prices can be mitigated though as a big harvest from Vietnam may balance the shortage of crops from Brazil.
Recent two El Ninos, the first of which happened between September 2006 and beginning of 2007, and the second started in June 2009 and peaked in January-February 2010, caused a significant rise in prices of grain crops, as can be seen from the Figures 1, 2, 3 and 4 below. Figures 1 and 2 depict the weekly price chart of a composite instrument created on the NetTradeX platform. The instrument is set as a basket of agricultural commodities made up of roughly equal parts (in dollar value) of corn, oats, soybean and wheat. Figures 3 and 4 depict the percentage price performances of these commodities for one year period in 2007 and 2010.
Figure 1: Price of basket of 4 grains 2006/07
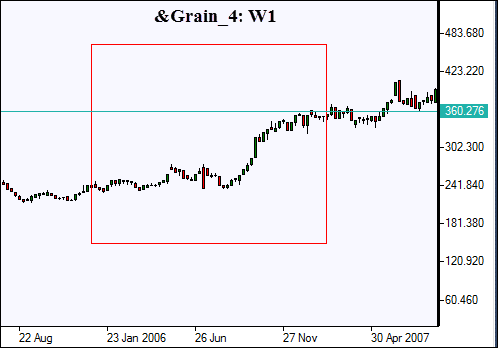
Figure 2: Price of basket of 4 grains 2010/11
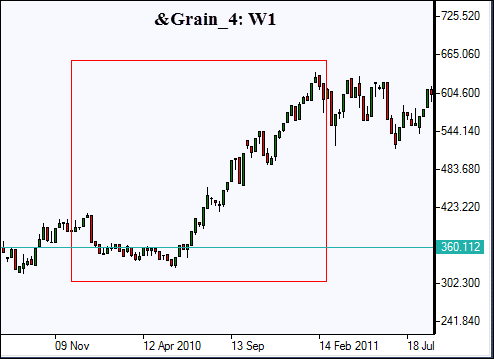
Figure 3: Percentage price chart for wheat, corn, soybean and oats in 2007 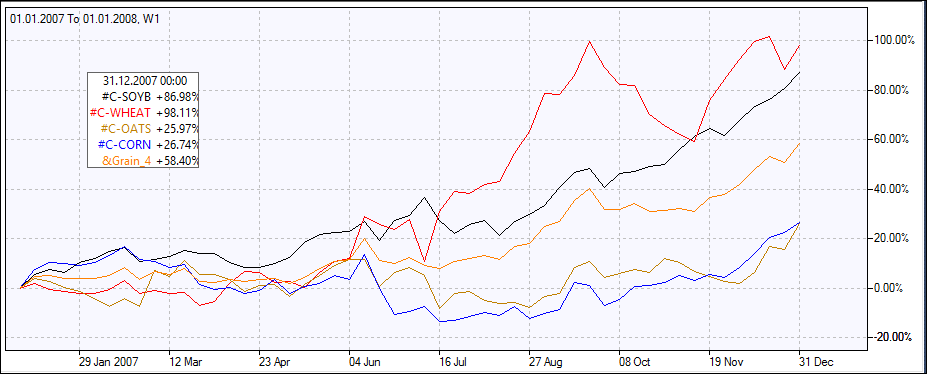
Figure 4: Percentage price chart for wheat, corn, soybean and oats in 2010 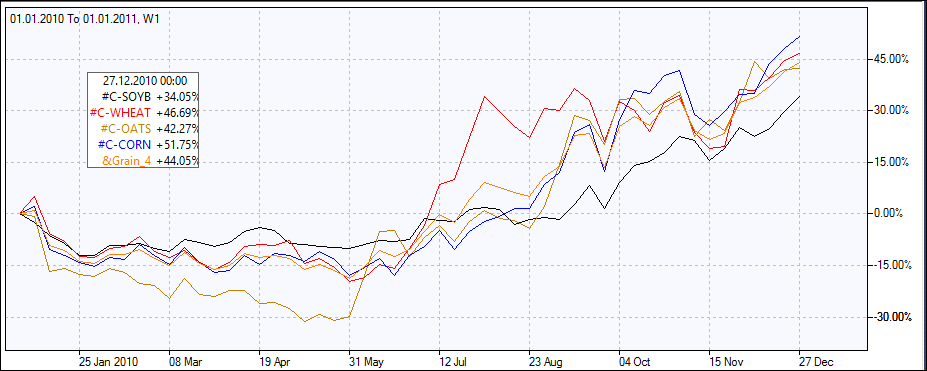
As is evident from the charts above, the prices of wheat, corn, soybean and oats increased considerably in the one year period after El Ninos of 2006/07 and 2009/10, registering price gains in the range of 26%-98% after the El Nino of 2006/2007. And the prices of four grain commodities rose at least 34% in the one year period after the peak of last El Nino, declining in the first half of the year and advancing in the second half year.
The current El Nino, which is expected to be the biggest in the last 15 years, may potentially have a significant impact on these grain prices. The prices of these four grains are falling since 2012, as can be seen from the weekly candlestick price chart of the composite instrument in the Figure 5.
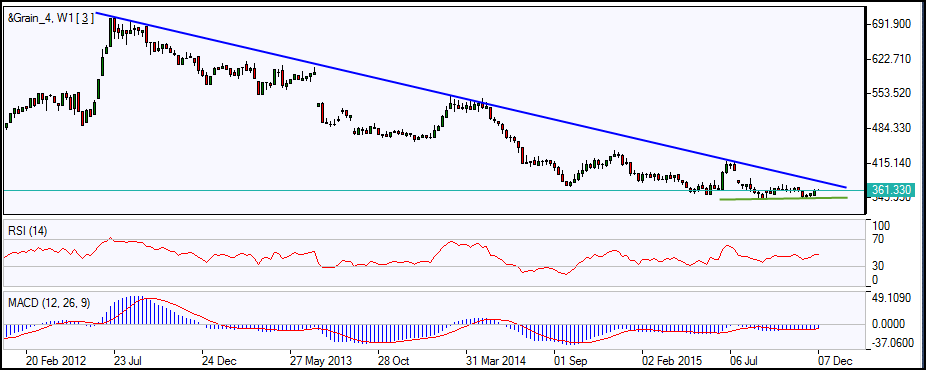
Figure 5: Price chart of grain composite instrument
A reversal of the current bearish trend would require a breakout above the multiyear trend resistance line. While the price is currently rising and both the RSI and MACD indicators are inching up, the price is still below the resistance line and is not clear whether it will test successfully the resistance line and reverse the downtrend yet. And in case of such development the magnitude of any price increases in coming months will be limited by the strength of the US dollar: the US dollar, measured in terms of the ICE US Dollar Index, has strengthened about 33% since December 2009, and will continue rising as the Federal Reserve is set to start normalizing the interest rates with the first rate hike expected in mid-December.
