NFP Touchdown:
Friday’s Nonfarm Payrolls number out of the US missed market expectations, but combined with a lift in Average Earnings and a fall in the Unemployment Rate, the miss was not enough to dampen a USD rally as the market re-priced itself on some much needed positive news.
“USD Average Hourly Earnings m/m (0.5% v 0.3% expected)”
“USD Non-Farm Employment Change (151K v 189K expected)”
“USD Unemployment Rate (4.9% v 5.0% expected)”
As we spoke about last Friday, the market got its jump in Average Hourly Earnings (the biggest increase since 2009 mind you) and pounced all over it with the expectation that the Fed will use the figure in future rhetoric as we head toward lift-off number 2.
EUR/USD 4 Hourly:
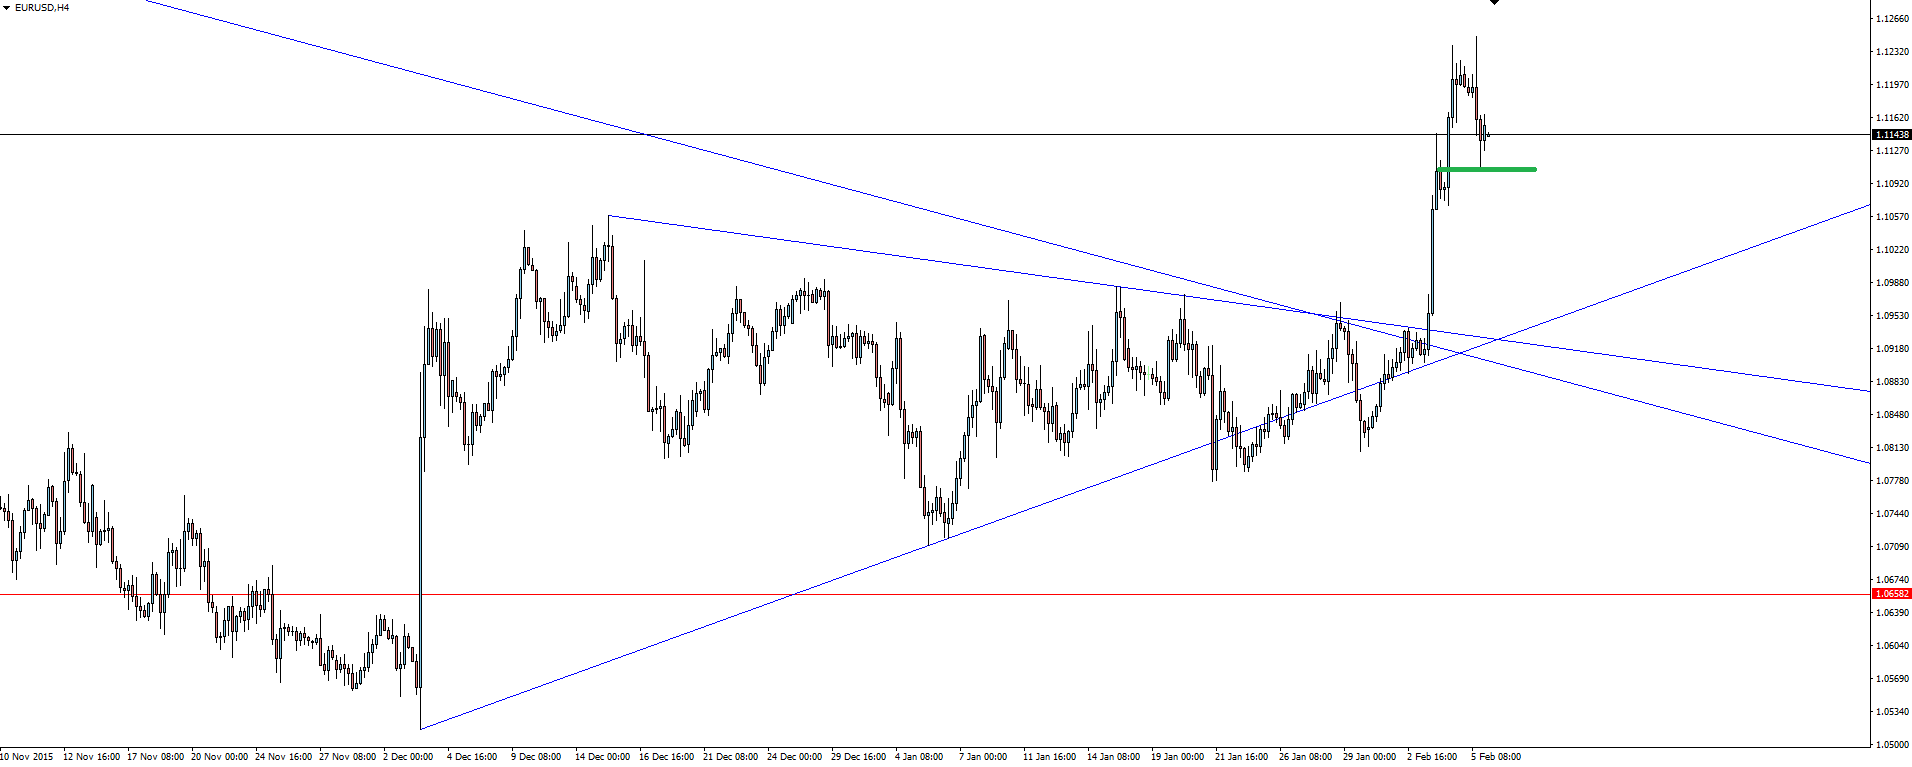
Following the triangle breakout, we have been watching EUR/USD price action. As a continuation to last Thursday’s chart of the day, we have here zoomed into the 4-hour Fiber chart to show just how bullish USD (bearish EUR) that Friday’s news spike was.
After getting a little vertical, NFP soon stopped price in its tracks and the pullback has come. What’s most interesting is where price has paused, right back into a short-term area of consolidation, giving any savvy bulls a chance to take some pips.
Is this a healthy pullback? Are shorts still trapped from the triangle break? Was the news enough to shift market sentiment?
Chart of the Day:
Our last technical analysis post on trading gold was all the way back in November 2015.
Back then, we compared the gold and silver charts to try to find the best opportunity to use the levels in play to manage our risk around. Following that post, price faked lower, before a shift in fundamental market conditions has seen gold catch a bid and rally off its lows.
XAU/USD Weekly:
Click on chart to see a larger view.
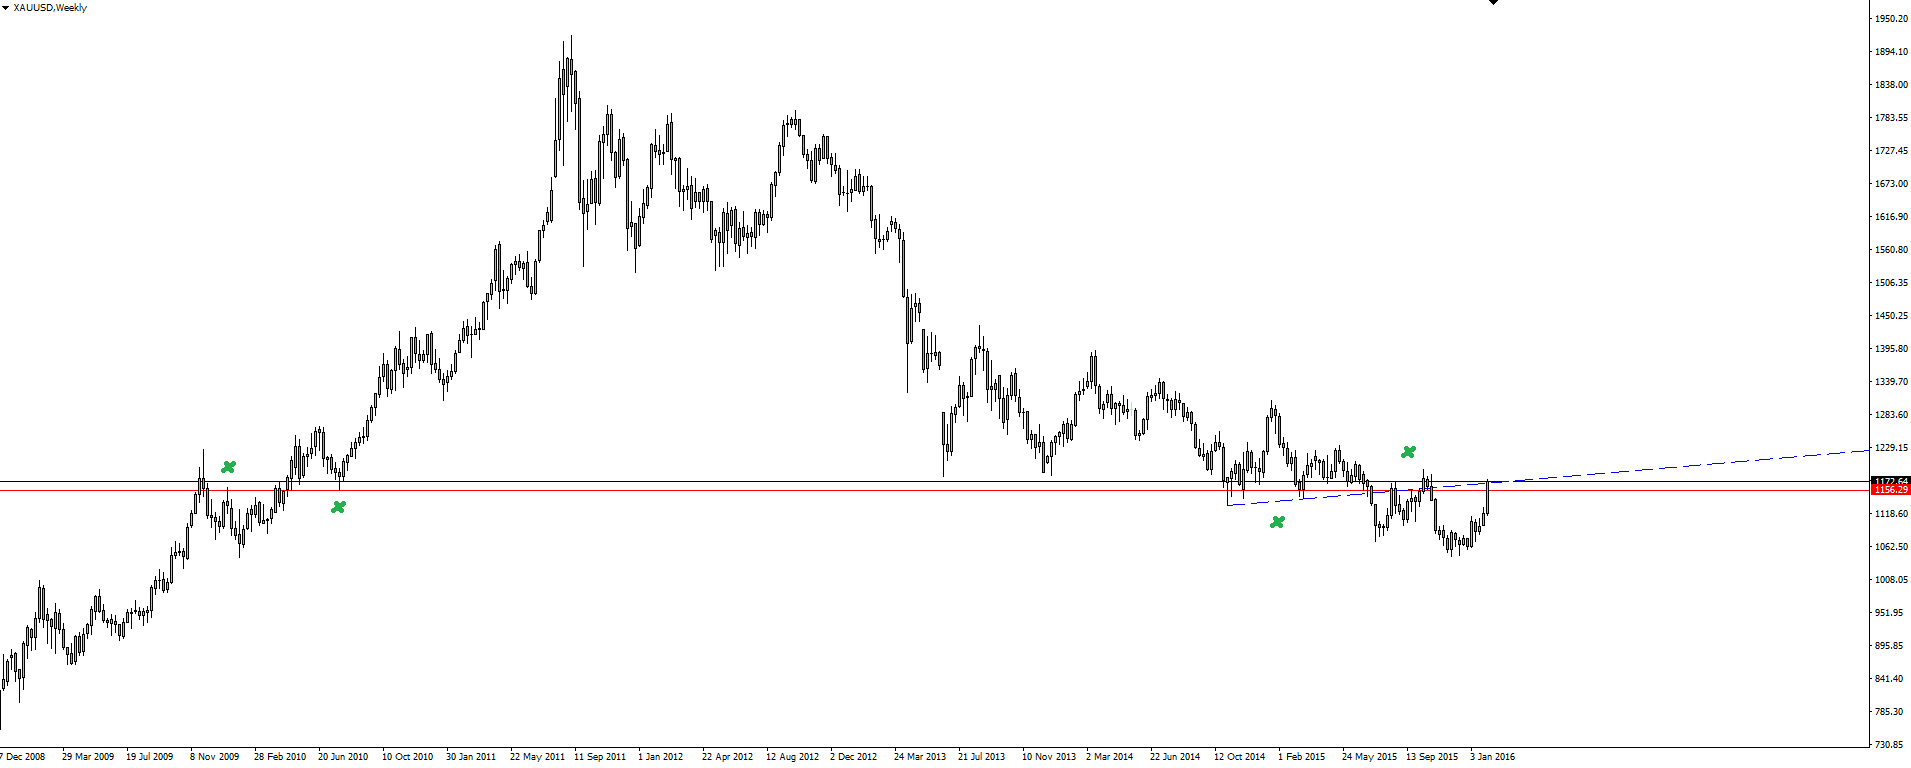
The weekly chart highlights the horizontal support zone that price has been playing with on either side for years. For clarity here, I have left only the single red line on the chart, being the top of the zone I had marked back in November.
XAU/USD Daily:
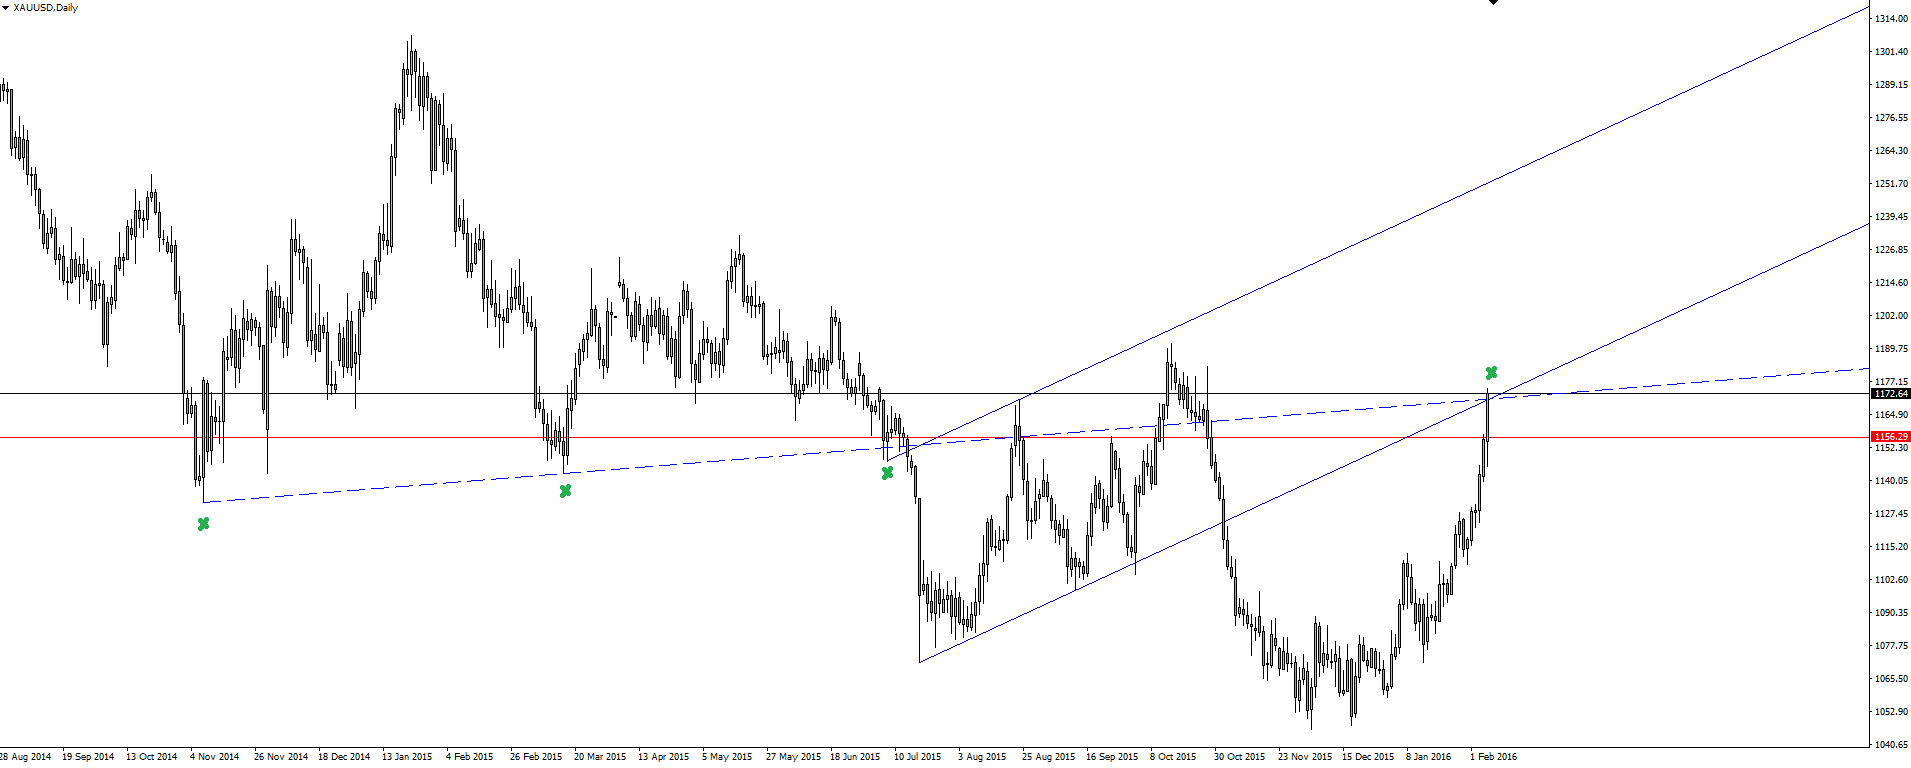
Zooming into the daily is where things start to get interesting. The previously broken flag/bullish channel pattern is back in play, this time using the underside of the level to mark possible resistance.
Will gold’s recent rally be halted here?
On the Calendar Monday:
NZD Bank Holiday
CNY Bank Holiday
JPY Current Account
CAD Building Permits m/m
CAD Gov Council Member Lane Speaks
“Waitangi Day (named after Waitangi, where the Treaty of Waitangi was signed) commemorates the signing of the Treaty of Waitangi, New Zealand’s founding document, on that date in 1840.”
“Chinese New Year is an important Chinese festival celebrated at the turn of the traditional lunisolar Chinese calendar.”
Disclosure: In addition to the website disclaimer below, the material on this page prepared by Vantage FX Pty Ltd does not contain a record of our prices or solicitation to trade. All opinions, news, research, Forex trading tools, prices or other information is provided as general Forex news and marketing communication – not as investment advice. Consequently any person acting on it does so entirely at their own risk. The experts writers express their personal opinions and will not assume any responsibility whatsoever for the actions of the reader. We always aim for maximum accuracy and timeliness, and Vantage FX shall not be liable for any loss or damage, consequential or otherwise, which may arise from the use or reliance on this service and its content, inaccurate information or typos. No representation is being made that any results discussed within the report will be achieved, and past performance is not indicative of future performance.
