New highs were hit nearly everywhere last week, except for in your thermometer…
To the surprise of many, most of the major global equity indexes traded to new all-time highs last week. It was a risk-on week as investors bet that a Ukraine cease-fire would hold and Greece would sign a deal before the final bell rang. Add to this some improved EU GDP data (see Germany, a plunging euro isn’t that bad), several better than expected earnings reports and broad based selling in Fixed Income, and you had enough kindling to fire up the indexes. All-time or multi-year highs were made in the S&P 500, Russell 2000 (Small Caps), NASDAQ, and the sectors of Technology, Materials and Consumer Discretionary. So it was a good week if you were long risk and stayed inside by the warmth of the fire and your equity portfolio.
The most volatile measures of global risk remain Russia and Greece…
Last week both markets turned significantly higher on hopes that the situations in the Ukraine and in Athens could improve.
Apple (AAPL) and Cisco Systems (CSCO) were two of the market’s big spark plugs last week. Cisco, due to earnings, and Apple due to target upgrades, iWatch, iCar and Apple Pay…
“Cisco is back and it is back with a vengeance.” John Chambers, CE
“With, the largest Apple Pay retailer in terms of both transactions and sales, further reinforcing the notion that our customer base wants to take advantage of the latest digital technologies. This payment option has grown quickly to 2% of sales which we expect will continue to increase especially after the Apple Watch launches this year.”
Whole Foods conference call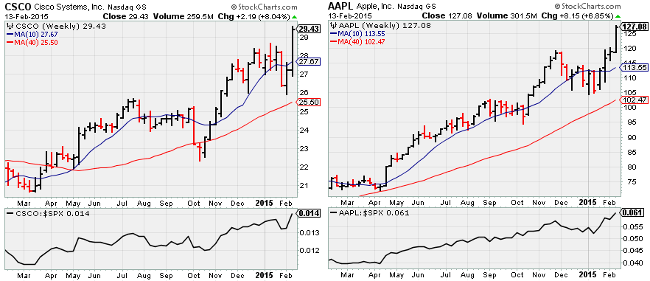
The moves in Cisco and Apple sparked all the Tech indexes to new levels…

Meanwhile, the downside moves were dominated by continued selling in Bonds and Utilities. American Express (NYSE:AXP) was a top decliner as it lost the Costco merchant and card business…
For the week, Risk shifted up a gear driven by Tech…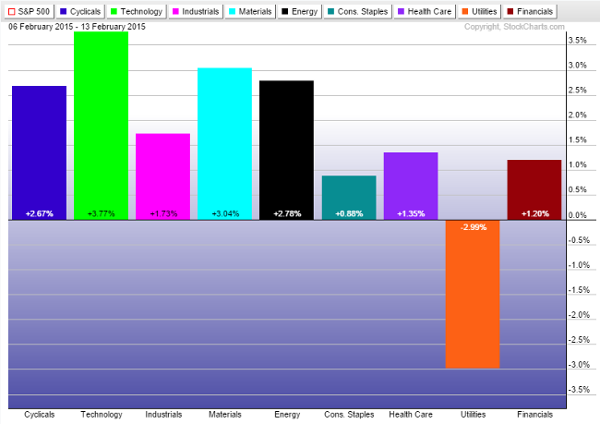
More broadly, Tech and the U.S. Equity markets led most asset returns globally…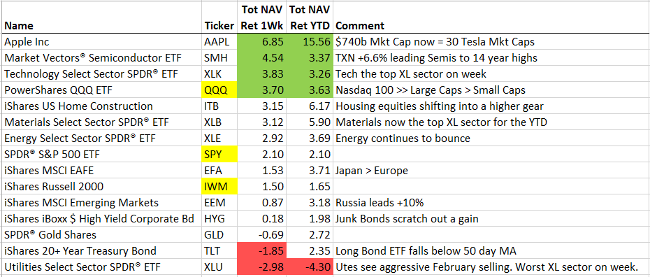
Also benefiting from the Risk-On sentiment is Junk Bonds which continue to gain against higher quality bonds…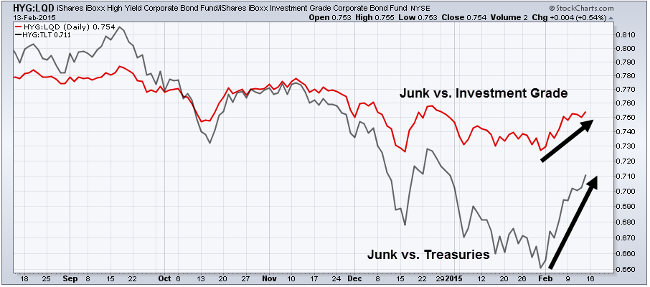
And AB will remind you that High Yield is not junk when looked at on a risk adjusted return basis…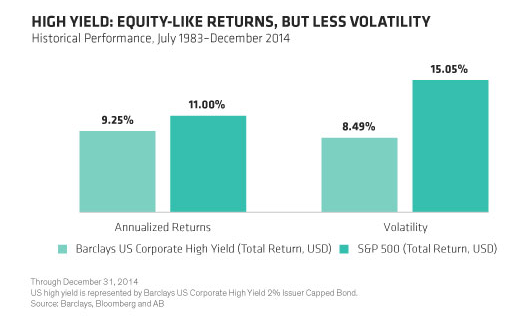
After a 50% decline over 8 months, Crude Oil retests its 50 day moving average…
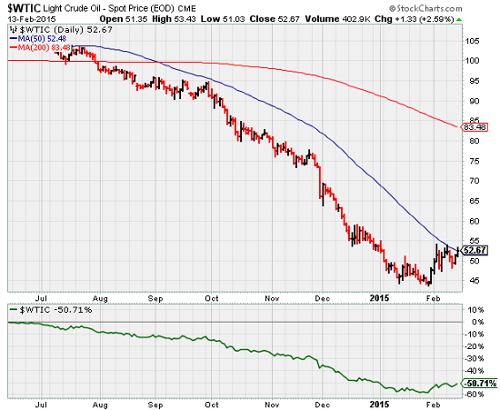
Energy is still a leading topic at most investment discussions (see this week’s Barron’s). The weekly rig numbers remain in retreat and will likely continue…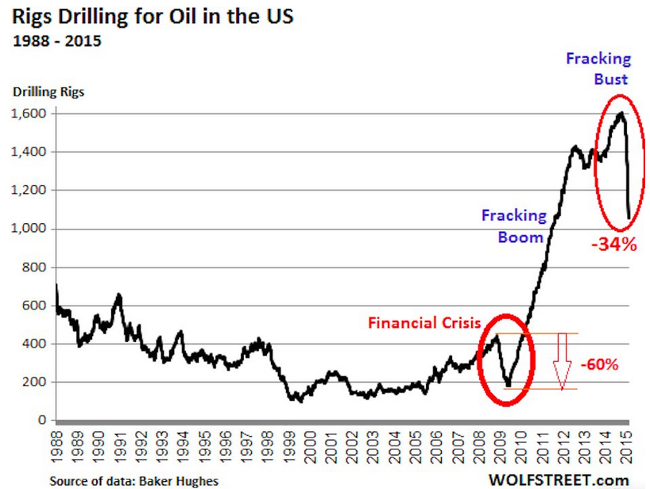
On the drilling side, the bust began in mid-October last year, after the price had been plunging for over three months. At that time, 1,609 rigs were actively drilling for oil, according to Baker Hughes (NYSE:BHI). Since then, week after week, drillers were idling rigs as fast as they could. In the latest reporting week, drillers idled another 84 rigs, the second biggest weekly cut ever, after idling 94 rigs two weeks earlier. Only 1056 rigs are still drilling for oil, down 443 for the seven reporting weeks so far this year and down 553 – or 34%! – from the peak in October
Even with the decline in new drilling, Cushing, OK looks like it will run out of storage space this summer…
@jenrossa: Is Cushing, Oklahoma, going to run out of storage for oil? Probably. From our Oil Brief: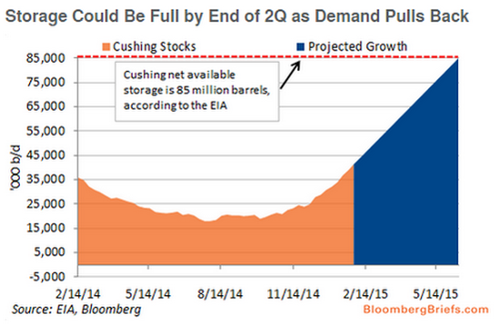
Some investors are good at buying companies hitting new lows; I am not one of those investors.
Keep in mind that several of those names going to new lows end up disappearing from the S&P 500 each year. Will the current disruption in Energy cause several of them to disappear?
(Michael Cembalest/J.P. Morgan Asset Management)
Maybe Houston will be able to convert some of its new office capacity into crude oil storage…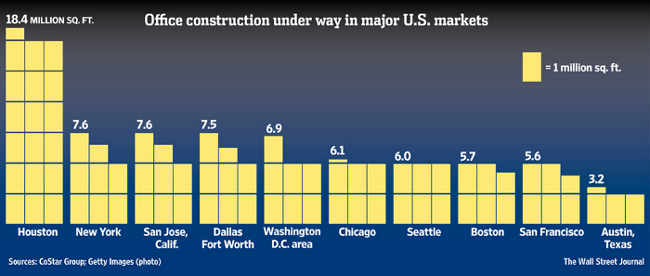
The jagged skyline of this oil-rich city is poised to be the latest victim of falling crude prices. As the energy sector boomed in recent years, developers flocked to Houston, so much so that one-sixth of all the office space under construction in the entire U.S. is in the metropolitan area of the Texas city. But now, the need for more offices is drying up, thanks to a drop in oil prices that has spun energy companies from an outlook of optimism and growth to anxiety and cutbacks. Oil prices have fallen by more than 50% since June. Demand for office space is “going to basically stop,” said Walter Page, director of office research at property data firm CoStar Group Inc. “It hurts a lot more when you have a lot of construction.
A chart for the wall of any North American farmer…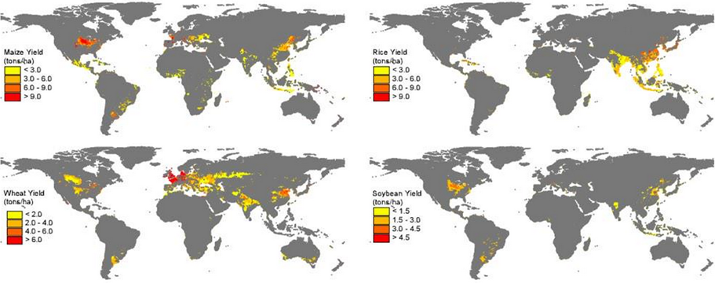
While many indexes broke out to new highs last week, one of the more interesting ones occurred in the Home Builders…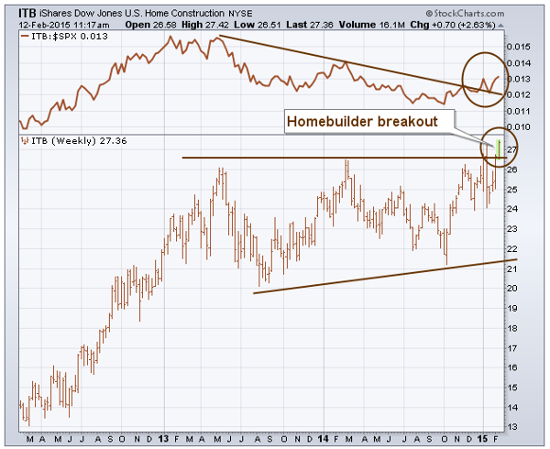
The weekly bars show the Dow Jones Home Construction iShares (NYSE:ITB) breaking out of a nearly two-year trading range on the upside. That puts the ITB at the highest level since 2007 when the housing market was in total collapse. The ITB/SPX ratio (top of chart) is also turning up after nearly two years of underperformance. The combination of lower mortgage rates, more discretionary spending from lower gasoline prices, and a better job market may be temping home buyers back into the market. And the spring buying season is just ahead
Now would be a good time to cut back on the debt dosage…
The U.S. Treasury now pays less in interest dollars than 2008 despite a doubling in outstanding debt.
(Goldman Sachs)
Disclaimer: The information presented here is for informational purposes only, and this document is not to be construed as an offer to sell, or the solicitation of an offer to buy, securities. Some investments are not suitable for all investors, and there can be no assurance that any investment strategy will be successful. The hyperlinks included in this message provide direct access to other Internet resources, including Web sites. While we believe this information to be from reliable sources, 361 Capital is not responsible for the accuracy or content of information contained in these sites. Although we make every effort to ensure these links are accurate, up to date and relevant, we cannot take responsibility for pages maintained by external providers. The views expressed by these external providers on their own Web pages or on external sites they link to are not necessarily those of 361 Capital.
