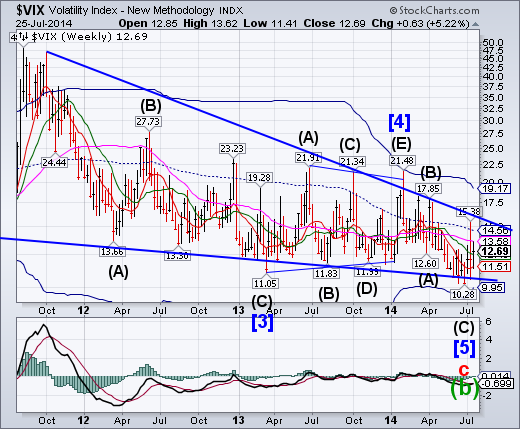
Volatility S&P 500 found support at its Short-term support at 11.51.It closed above Intermediate-term support at 12.45. The follow-through next week may be very surprising..
SPX’s closes flat this week
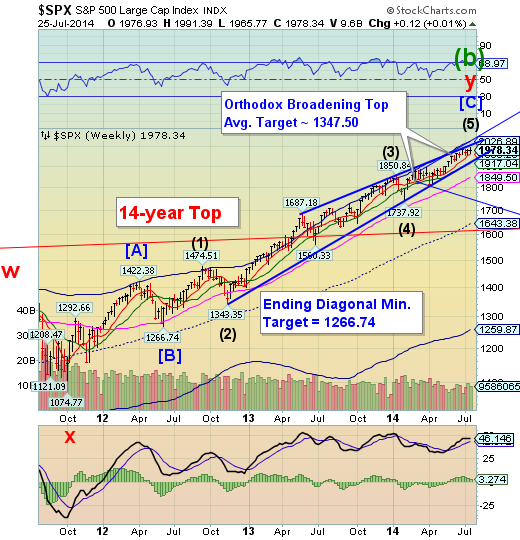
SPX made a new high on Thursday but closed flat for the week.On Friday, it tested its weekly Short-term support for the second time since April.The surprise of the week is that the algos had to get to work in the final hour on Friday just to have a breakeven week. Earnings and risk are starting to matter to investors.
ZeroHedge: Despite an impressive ramp by USDJPY in the last two hours of trading (thank you Nomura and BOJ) whose purpose was to get the DE Shaw and all other correlation algos to push spoos higher, today's trifecta of the ugly guidance by Visa (which dominated the DJIA), very ugly earnings by Amazon (which dominated the Nasdaq) and the CME ES margin hike just proved too much, and while Friday may have been the new Tuesday following 11 "green" DJIA Fridays in a row, today's 123 point drop stopped the trend before lucky 12 out of 12.
NDX completes 15 weeks straight up
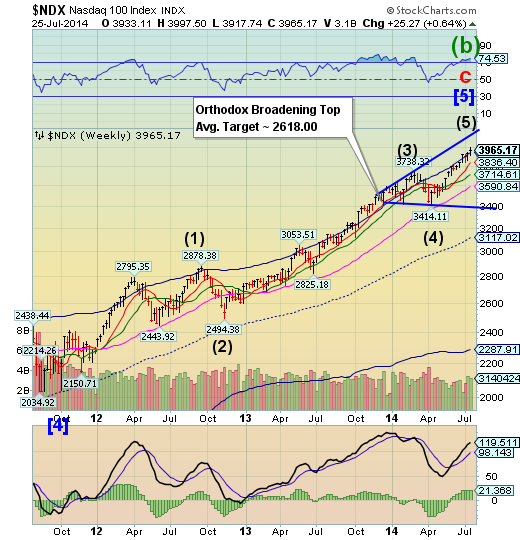
NDX completed 15 weeks of rally since its low on April 15.In the process, it completed the final bullish phase of an Orthodox Broadening Top. Robert Edwards and John Magee, in their classic “Technical Analysis of Stock Trends,” say this, “This would bear out the earlier characterization of this sort of pattern as suggesting active, excited trading with much public (and, hence, not too well informed or managed) participation. Such conditions are naturally associated with the final phase of a Bull Market.” (page 148)
ZeroHedge: For almost three years there has been one recurring simple strategy to outperforming the market - find the worst company you can, and buy its stock with both hands and feet... As we have discussed numerous times, the massive outperformance of "weak balance sheet" companies over "strong balance sheet" companies - the absolute sign of a massive mal-investment boom - has been a straight line to profits with hardly a hiccup since the Fed unleashed QE2. However, the last week or so, as geopolitical risks rise and it appears ever more likely that the Fed's free money pipe will dry up, the dash-for-trash has reversed.
The Eurois in full decline
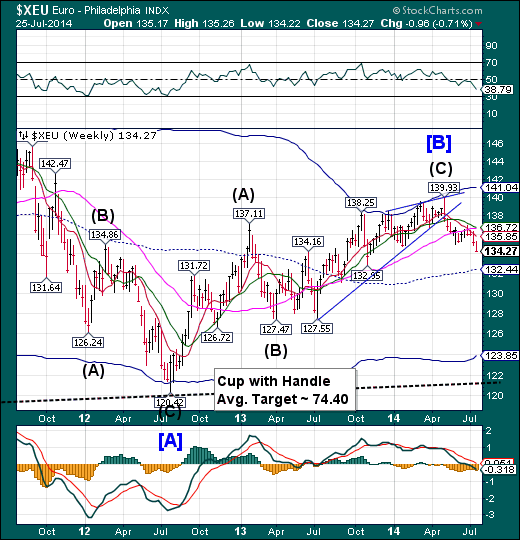
The Euro continued its decline toward its mid-Cycle support at 132.44.The Cycles Model suggests that the current decline may be short – less than two weeks, but after a brief intermission, may decline in earnest through the end of August.SinceEndingDiagonals are usually fully retraced, we may expect a high probability of testing its weekly Cycle Bottom at 123.32 or the Lip of the Cup with Handle formation at 121.50 in either two weeks or by the end of August.
WSJ: The euro fell against rivals on Friday as weaker-than-expected German data highlighted the diverging interest-rate prospects for the euro zone and other regions.
The euro slid 0.3% against the greenback, to $1.3428, down 0.7% for the week and reaching its weakest level in eight months. The euro lost 0.2% versus the pound and the yen, down to £0.7912 and to ¥136.76, respectively.
Euro Stoxx between support and resistance.
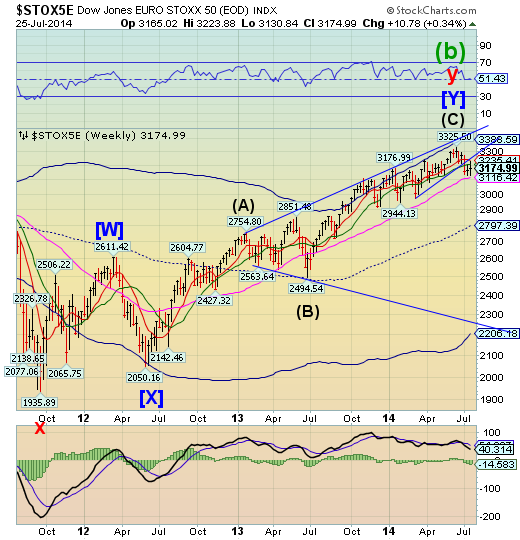
The DJ Euro Stoxx 50 index spent a second week under its Ending Diagonal trendline and Short-term resistance at 3235.41.Long-term support lies beneath it at 3116.42. The Broadening formation suggests no further support until it reaches its weekly Cycle bottom at 2206.18.
ZeroHedge: While the preliminary terms of Europe's Russian sanctions were leaked yesterday, moments ago it was reported that EU ambassadors have reached an agreement on what the "hard-hitting" economic sanctions against Russia would look like even as details remain to still be ironed out ahead of a formal announcement of the final terms next week. According to Reuters, key measures suggested by the Commission include:
closing EU capital markets to state-owned Russian banks,
an embargo on arms sales to Moscow,
restrictions on the supply of energy and dual-use technologies.
a list of 15 individuals and 18 entities, including companies, subject to asset freezes for their role in supporting Russia's annexation of Crimea and detribalization of eastern Ukraine.
The Yen retests the Triangle formation
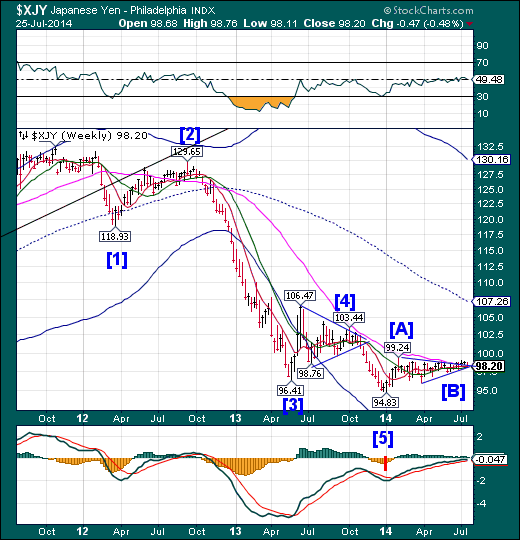
The Yen has tested the top of its Triangle formation for possibly the last time as it prepares to launch a large retracement. Triangles often act as a springboard from which an index may make a very strong, but terminal move. In this case, the intended target may be mid-Cycle resistance at 107.26. The Cycles Model suggests the Yen may rally sharply for the next two weeks.
The Nikkei spends four weeks at resistance
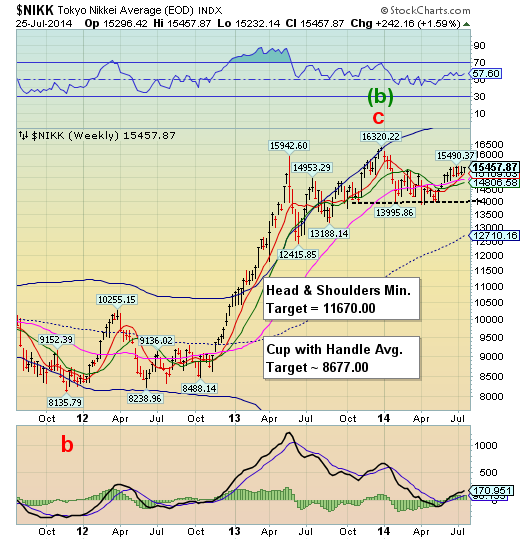
The Nikkei 225 completed a Primary Cycle high on July 4 and has stayed in a tight range since then.This type of action rarely remains over a month, so we should see a reversal imminently. The Cycles Model suggests a decline may resume that could last through mid-August.
WSJ: Japanese stocks closed at a six-month high on Friday, as a weaker yen buoyed the market at the end of a positive week for Asian stocks.
Japan's Nikkei Stock Average rose 1.1% to 15457.87 as the yen softened against the dollar—a positive for the country's exporters. The dollar gained 0.3% against the yen overnight and edged higher in Asian trade, last trading at ¥101.89 compared with ¥101.81 late Thursday in New York.
The yen was creeping closer to the ¥102-to-the-dollar mark that it has been trading around in recent months, after it strengthened sharply late last week after a Malaysia Airlines 3786.KU -2.22% plane was shot down over Ukraine. With geopolitical tensions easing over the week, the yen has softened and stocks have been able to rise.
U.S. Dollar is testing its Triangle trendline.
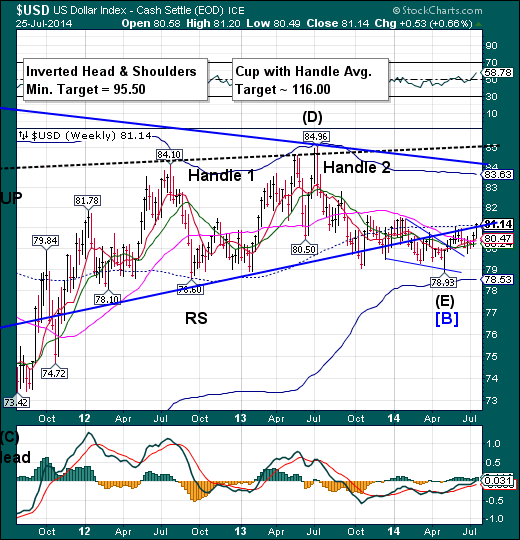
The US Dollar Index is now testing the Triangle trendline and mid-Cycle resistance at 81.08.Last week I suggested that, “the Dollar has launched a Primary Cycle which may permit it to break out above its Triangle trendline and mid-Cycle resistance at 81.10.Since the current cycle is right-translated (bullish), the probabilities are high that we may see a breakout rally next week.” So it was.
Reuters: Speculators increased their bullish betson the U.S. dollar in the latest week, according to data fromthe Commodity Futures Trading Commission released on Friday.
The value of the dollar's net long position rose to $14.12billion in the week ended July 22, from $9.94 billion theprevious week.
USB makes a new retracement high.
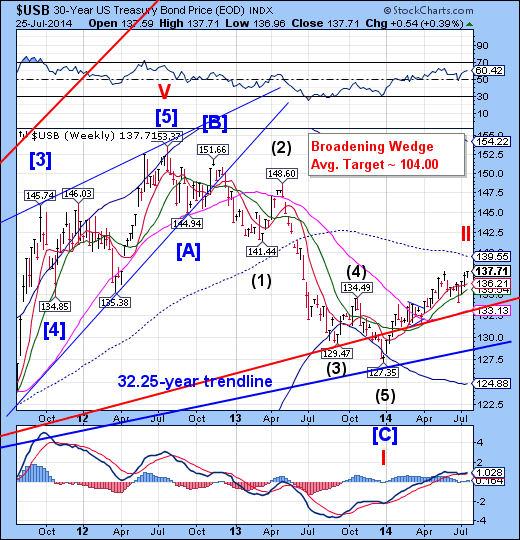
The Long Bond extended its“very aggressive retracement”this week.This changes the cyclical outlook to positive for another two weeks.
WSJ: Investors piled into U.S. Treasury bonds on Friday as the latest economic reports out of Germany and the U.S. raised concerns over the pace of global economic growth.
The buying sent the benchmark 10-year note's yield toward the lowest point of the year. The yield on the 30-year bond fell to near a 13-month low.
In late afternoon trading, the benchmark 10-year note was 11/32 higher, yielding 2.469%, according to Tradeweb. The 30-year bond was 1 1/32 higher, yielding 3.244%.
Bond yields fall as their prices rise.
More Gold vaporizes unexpectedly.
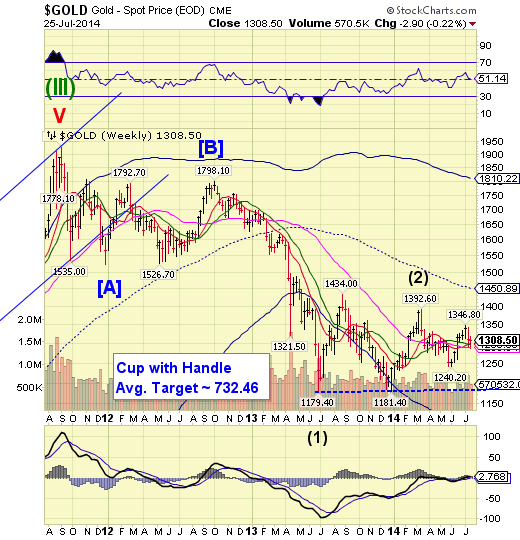
Gold bounced from its weekly Long-term support at 1290.30 this week.It bounced above its all- important 1300.00level but appears to be ready to resume the decline very soon.The next stop is a potential Trading Cycle low due at the end of July or the first week of August.
ZeroHedge: It's one thing to implicitly admit that there is a physical gold shortage and as a result nations - such as Germany - are unable to repatriate their physical gold held in the safe and trusted confines 90 feet below the NY Fed, gold which may or may not be there and has likely been leased out exponentially to cover paper shorts by virtually every BIS-overseen central bank (and the BIS paper gold selling team itself of course). It is something totally different to corzine, as in vaporize, 87,000 ounces of physical gold, some 2.7 tons, and blame it on a computer upgrade glitch. Which is precisely what Rand, Africa's largest refinery and processor of about a third of the world's gold since 1920, has done after it "discovered" that $113 million in precious metal was missing after "adopting a new computer system."
Crude is caught between support and resistance
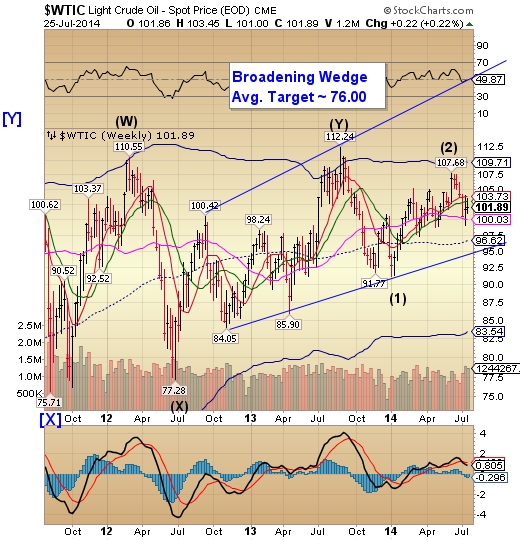
Crude Oil seems to be caught between its Long-term support at 100.03 and Short-term resistance at 103.73.The question remains. Will there be yet another probe at the Cycle Top resistance at 109.42 or a failure?Crude prices, which are subject to political pressures, are between a rock and a hard place.
Energy Global: According to the US Energy Information Administration (EIA), sales of crude oil, petroleum products and natural gas accounted for 68% of Russia’s total export revenues in 2013. Russia received almost four times as much revenue from exports of crude oil and petroleum products as from natural gas.
Most of Russia’s exports of crude oil and products, as well as virtually all exports of natural gas, are delivered to Europe, including Turkey. Asia (in particular China) receives substantial volumes of crude oil and some LNG. Recently, Russia finalised a 30 year, US$ 400 billion natural gas supply deal with China. North America imports some Russian petroleum products, particularly unfinished oils used in refineries.
China testing its mid-Cycle resistance
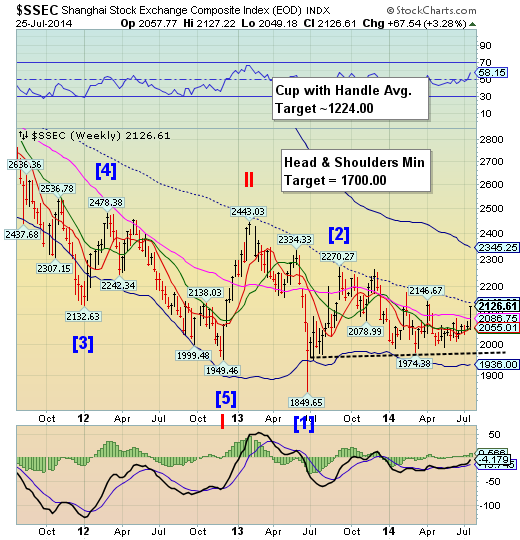
The Shanghai Composite made an attempt at its mid-Cycle resistance at 2140.82 this week.It may sustain the rally for yet another week, but mid-Cycle resistance appears very strong. The decline towards its Cycle Bottom at 1936.00 should resume shortly thereafter.
ZeroHedge: Having shown 11 awkward-to-explain charts of the Chinese economy, exposed the liquidity crisis that still lingers just under the surface, and exposed the "discrepancies that abound" in China's data, it was only right and proper in this new topsy-turvy normal that HSBC China Manufacturing PMI - after 8 months of missed expectations (but a very recent surge to the highest levels in 2014) - should smash expectations and surge to 52.0, its highest since Jan 2012 (and 2nd highest since the recovery began).
The Banking Index is limping above Intermediate-term support.
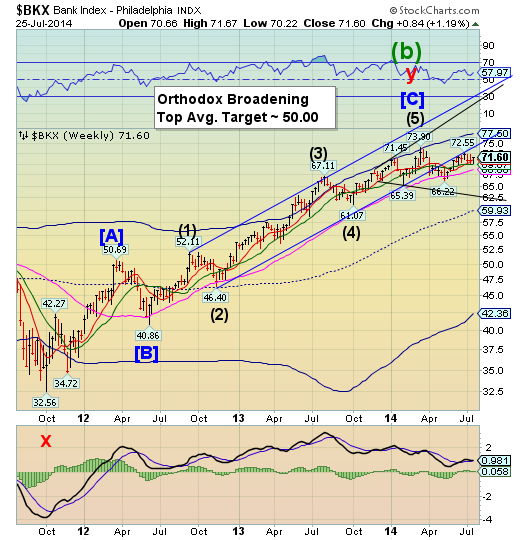
BKX tested weekly Intermediate-term support at 69.87 for a third week beneath the July 3 high and the lower trendline of its formerly bullish trading channel. Considering the new highs being made by the Dow Jones Industrials, this anomaly is a glaring non-confirmation of the other equity indices. A further decline from here may complete its Orthodox Broadening Top formation by breaking the bottom near 62.50.
ZeroHedge: Ten dark suited men entered the premises of FBME bank in Cyprus on Friday afternoon and took it hostage.
It must have looked like a scene from the Matrix. And given the surrealism of how this conflict is escalating, maybe it was.The men were from the Central Bank of Cyprus (CBC). Andthey commandeered FBME because an obscure agency within the US government recently issued a report accusing the bank of laundering money.
It just so happens that FBME… and Cyprus in general… iswhere a lot of wealthy Russians hold their vast fortunes.Bear in mind, there has been no proof that any crime was committed. There was no court hearing. No charges were read. It wasn’t even the government of Cyprus who accused them of anything.There was just a generic report penned by some bureaucrat 10,000 miles away.
ZeroHedge: First it was French BNP that was punished with a $9 billion legal fee after France refused to cancel the Mistral warship shipment to Russia (which promptly led to French National Bank head Christian Noyer to warn that the days of the USD as a reserve currency are numbered), and now moments ago, none other than the 150x-levered NY Fed tapped Angela Merkel on the shoulder with a polite reminder to vote "Yes"on the next, "Level-3" round of Russia sanctions when it revealed, via the WSJ, that "Deutsche Bank's giant U.S. operations suffer from a litany of serious problems, including shoddy financial reporting, inadequate auditing and oversight and weak technology systems."
ZeroHedge: The Swiss National Bank and the People’s Bank of China reached a currency swap agreement this week. While this is not a huge trend changer in the near-term, it demonstrates that our forecast for China to become the largest economy and to be the next financial capital of the world when Europe and the USA blow themselves apart with defaulting socialism is on track. This agreement will allow the two central banks to buy and sell their currencies up to a limit of 150 billion renminbi, or 21 billion Swiss francs ($23.4 billion).
Have a great weekend!
Disclaimer: Nothing in this email should be construed as a personal recommendation to buy, hold or sell short any security. The Practical Investor, LLC (TPI) may provide a status report of certain indexes or their proxies using a proprietary model. At no time shall a reader be justified in inferring that personal investment advice is intended. Investing carries certain risks of losses and leveraged products and futures may be especially volatile. Information provided by TPI is expressed in good faith, but is not guaranteed. A perfect market service does not exist. Long-term success in the market demands recognition that error and uncertainty are a part of any effort to assess the probable outcome of any given investment. Please consult your financial advisor to explain all risks before making any investment decision. It is not possible to invest in any index.
