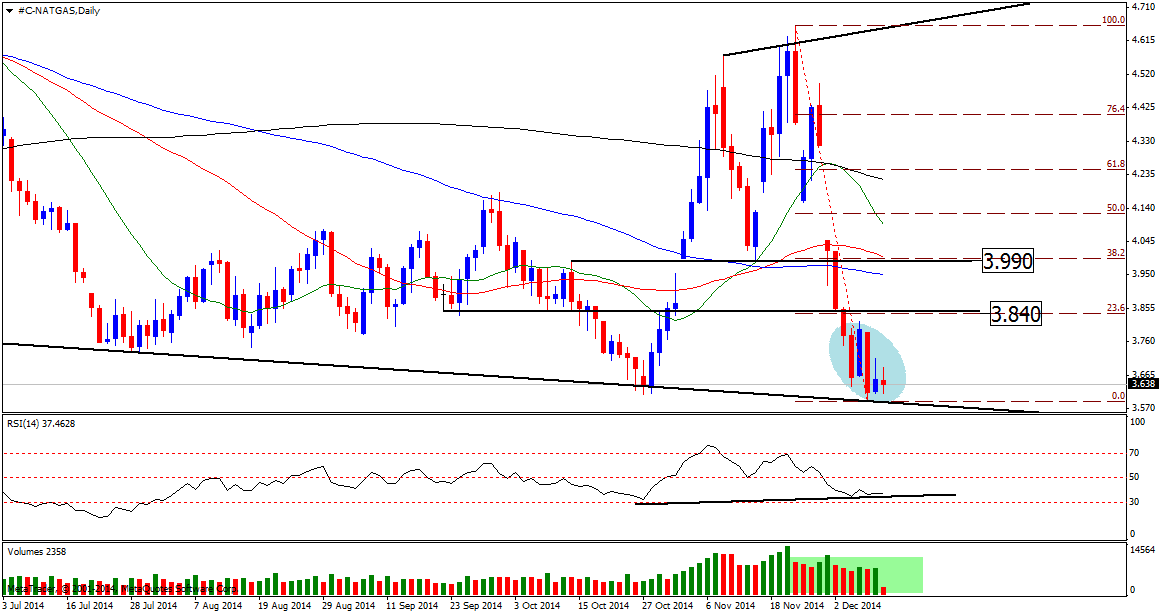
Natural gas (10.12.2014) respected our last article & fall to the mention target area. As always traders becoming more bearish due to last week fall in natural gas & we feel its time to have a sharp look at future prospect.
On fundamental side, the average inventory withdrawal staying on higher side since november 2014 due to harsh winter in major part of US. However some relief has been seen but how long in the winter season ? Overall, inventory level are still down by more than 400 bcf compare to 5 year inventory while prices premium is still pending. A little push from winter may put rocket under natural gas prices. Probably we need to wait for 2-3 weeks more for that.
On charts, natural gas is trading around $3.638 & it was bouncing from multiple support trendline which is holding natural gas prices for the year 2014. Meanwhile we also witness a major shift on volume with bullish & bearish candles. Higher volume associated with bullish candle suggest the majority of trader while a positive divergence on RSI indicating for a reversal or shot covering ahead. Most probably correction towards $3.840& then $3.990 possible in coming trading session.
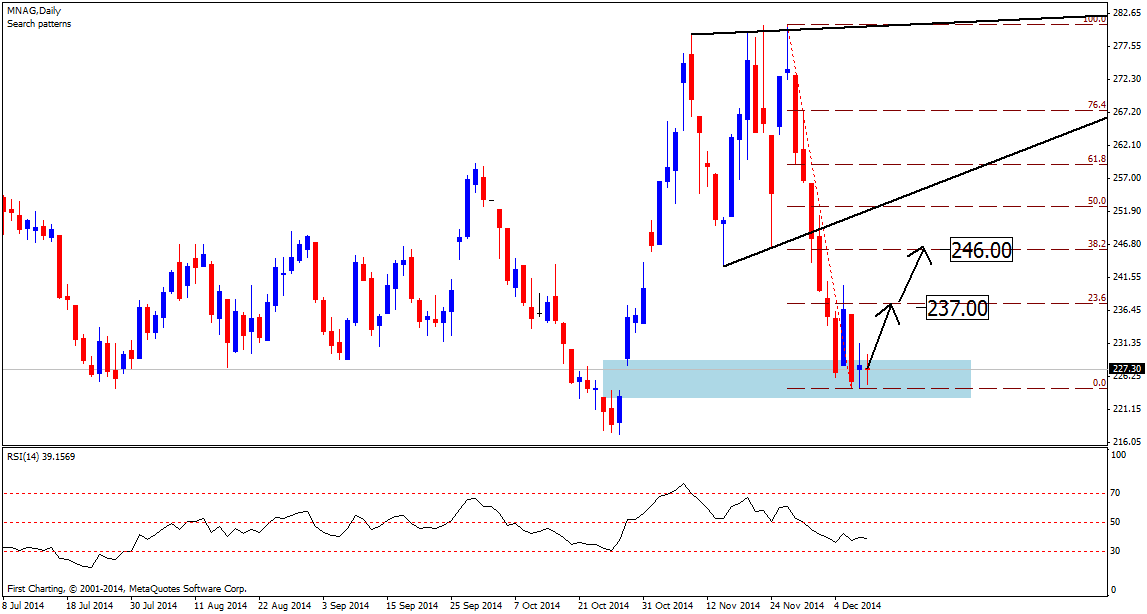
Mcx natural gas trading around 227 & we can see on charts, natural gas fall sharply towards 225 mark which represent the support zone as well as a very strong parallel support. Although mcx charts having a contract gap with lower range at 223 (which is almost filled now) , the yearly bottom is very close. Continue placing shooting star candles around support zone, hinting for a reversal & we may witness a sharp move towards 237 & then may be 246 in coming trading session specially if inventory hit more withdrawal than forecast (-45 bcf) 
Based on above studies, we will prefer to buy natural gas for an upside rally in coming trading session.
Note - Above technical analysis is not a buy/sell recommendation.
Original post
- English (UK)
- English (India)
- English (Canada)
- English (Australia)
- English (South Africa)
- English (Philippines)
- English (Nigeria)
- Deutsch
- Español (España)
- Español (México)
- Français
- Italiano
- Nederlands
- Português (Portugal)
- Polski
- Português (Brasil)
- Русский
- Türkçe
- العربية
- Ελληνικά
- Svenska
- Suomi
- עברית
- 日本語
- 한국어
- 简体中文
- 繁體中文
- Bahasa Indonesia
- Bahasa Melayu
- ไทย
- Tiếng Việt
- हिंदी
Natural Gas At Multiple Support Zone: Bull Time?

3rd party Ad. Not an offer or recommendation by Investing.com. See disclosure here or
remove ads
.
Latest comments
Install Our App
Risk Disclosure: Trading in financial instruments and/or cryptocurrencies involves high risks including the risk of losing some, or all, of your investment amount, and may not be suitable for all investors. Prices of cryptocurrencies are extremely volatile and may be affected by external factors such as financial, regulatory or political events. Trading on margin increases the financial risks.
Before deciding to trade in financial instrument or cryptocurrencies you should be fully informed of the risks and costs associated with trading the financial markets, carefully consider your investment objectives, level of experience, and risk appetite, and seek professional advice where needed.
Fusion Media would like to remind you that the data contained in this website is not necessarily real-time nor accurate. The data and prices on the website are not necessarily provided by any market or exchange, but may be provided by market makers, and so prices may not be accurate and may differ from the actual price at any given market, meaning prices are indicative and not appropriate for trading purposes. Fusion Media and any provider of the data contained in this website will not accept liability for any loss or damage as a result of your trading, or your reliance on the information contained within this website.
It is prohibited to use, store, reproduce, display, modify, transmit or distribute the data contained in this website without the explicit prior written permission of Fusion Media and/or the data provider. All intellectual property rights are reserved by the providers and/or the exchange providing the data contained in this website.
Fusion Media may be compensated by the advertisers that appear on the website, based on your interaction with the advertisements or advertisers.
© 2007-2024 - Fusion Media Limited. All Rights Reserved.