Get 40% Off
🚨 Volatile Markets? Find Hidden Gems for Serious OutperformanceFind Stocks Now

NASDAQ Reaches Target, What's Next?

Published 10/15/2016, 02:41 PM
Updated 07/09/2023, 06:31 AM

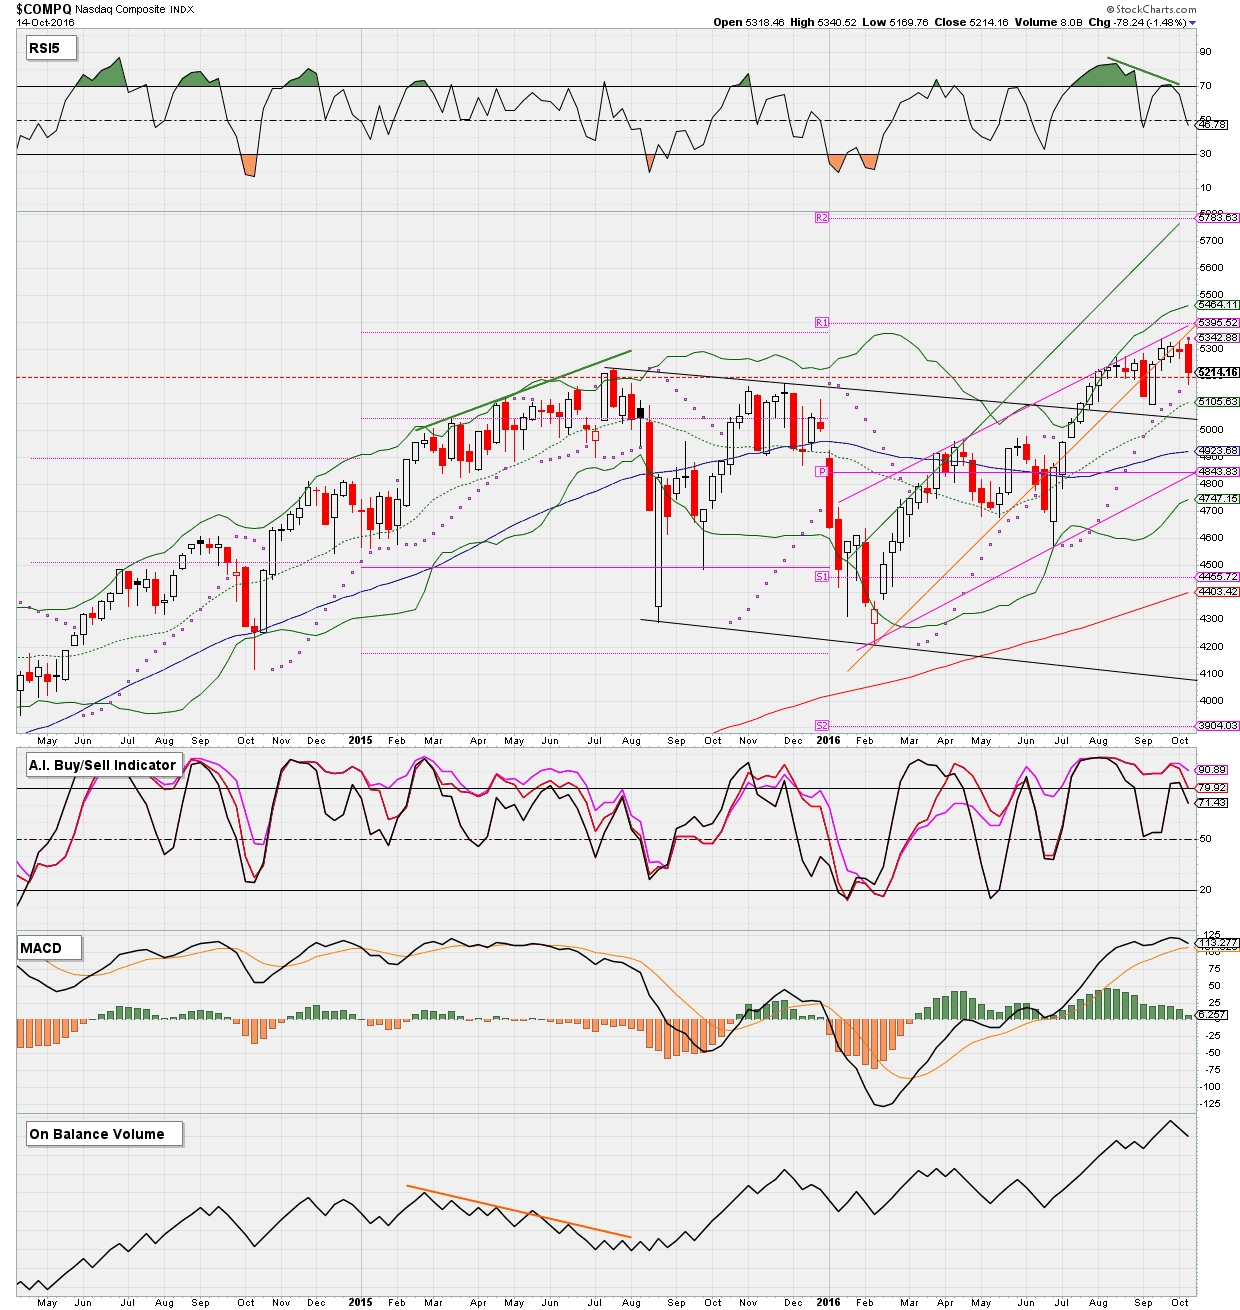
Since early July we've been forecasting the NASDAQ to move to $5300-$5400, when it was still at $4800. This week and three weeks ago it reached $5341 and $5343. Not too shabby a forecaste dare we say, as that's a 10+% gain in around 3 months without much headaches. That's what technical analyses does; it's accurate, unbiased, and based on facts. We don't do opinions at Intelligent Investing. But, all that is now water under the bridge, albeit solidifying Intelligent Investing's track record and adding credence to our next forecast. Now, what's next is all that matters in the stock market. The chart below shows the weekly candle stick chart of the NASDAQ ($COMPQ); and we can observe negative divergence on the Relative Strength Indicator (RSI5); an initial sell signal on our proprietary (A.I.) buy/sell Indicator (all 3 differently collored Technical Indicators -TIs- started to point down this week; see here for an indepth explanation); and the MACD and the OBV are also pointing down.

NASDAQ Weekly Chart with Technical Indicators.

Hence, plenty of bearish signals on the weekly charts. However, OBV shows no negative divergence like it did in 2015 (red and green solid lines); suggesting no major top has been put in place as money is stil flowing into the market. price found support at the first level (red dotted horizontal line): $5200 and second horizontal support is at $5100, which is also where the 20week simple moving average (SMA) resides. Note that around $5200 is also the prior highs from Summer 2015; thus we may simple be experiencing a break out retest. In addition, price is still in the blue uptrend channel.

3rd party Ad. Not an offer or recommendation by Investing.com. See disclosure here or remove ads .

In summary; based on the TIs we can expect lower lows to probably the $5100 region, which is where we expect price to find support and become sufficiently oversold to be able to establish the next run up to $5800, with a pit stop at $5500.

Latest comments

Risk Disclosure: Trading in financial instruments and/or cryptocurrencies involves high risks including the risk of losing some, or all, of your investment amount, and may not be suitable for all investors. Prices of cryptocurrencies are extremely volatile and may be affected by external factors such as financial, regulatory or political events. Trading on margin increases the financial risks.
Before deciding to trade in financial instrument or cryptocurrencies you should be fully informed of the risks and costs associated with trading the financial markets, carefully consider your investment objectives, level of experience, and risk appetite, and seek professional advice where needed.
Fusion Media would like to remind you that the data contained in this website is not necessarily real-time nor accurate. The data and prices on the website are not necessarily provided by any market or exchange, but may be provided by market makers, and so prices may not be accurate and may differ from the actual price at any given market, meaning prices are indicative and not appropriate for trading purposes. Fusion Media and any provider of the data contained in this website will not accept liability for any loss or damage as a result of your trading, or your reliance on the information contained within this website.
It is prohibited to use, store, reproduce, display, modify, transmit or distribute the data contained in this website without the explicit prior written permission of Fusion Media and/or the data provider. All intellectual property rights are reserved by the providers and/or the exchange providing the data contained in this website.
Fusion Media may be compensated by the advertisers that appear on the website, based on your interaction with the advertisements or advertisers.
© 2007-2024 - Fusion Media Limited. All Rights Reserved.