Upcoming US Event for Today:- ADP Employment report for March will be released at 8:15am. The market expects 193,000 versus 139,000 previous.
- Factory Orders for February will be released at 10:00am. The market expects a month-over-month increase of 1.2% versus a decline of 0.7% previous.
- Weekly Crude Inventories will be released at 10:30am.
Upcoming International Events for Today:
- Great Britain PMI Construction for March will be released at 4:30am EST. The market expects 63.0 versus 62.6 previous.
- Euro-Zone Producer Price Index for February will be released at 5:00am EST. The market expects a year-over-year decline of 1.6% versus a decline of 1.4% previous.
- Japan PMI Composite for March will be released at 7:15pm EST.
- China Non-Manufacturing PMI for March will be released at 9:00pm EST.
- China HSBC/Markit Services PMI for March will be released at 9:45pm EST.
The Markets
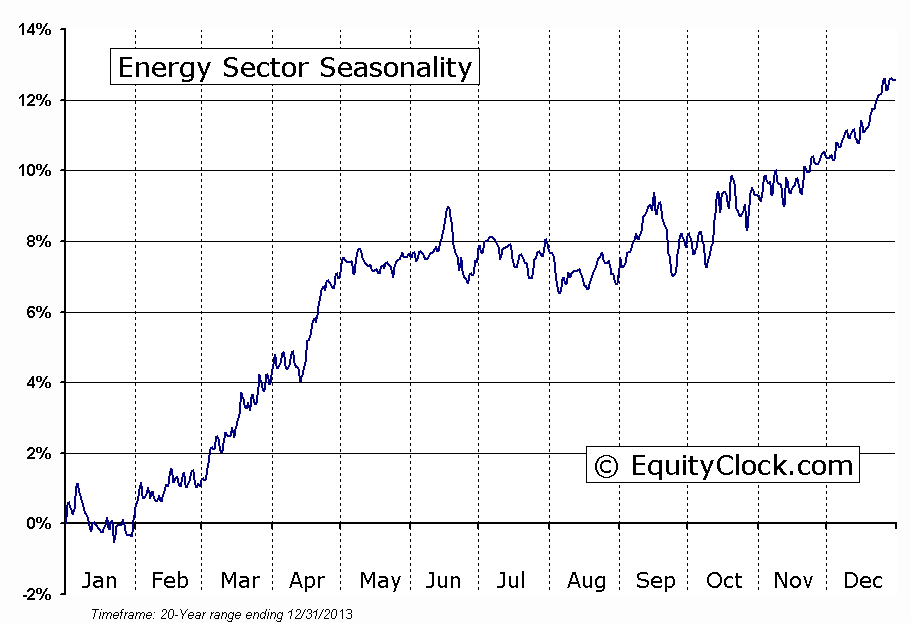
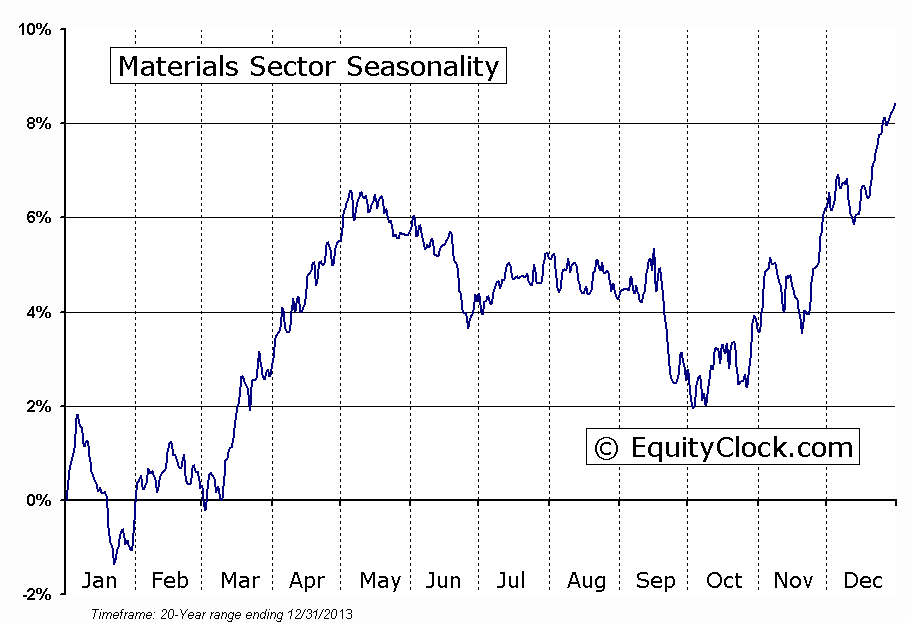
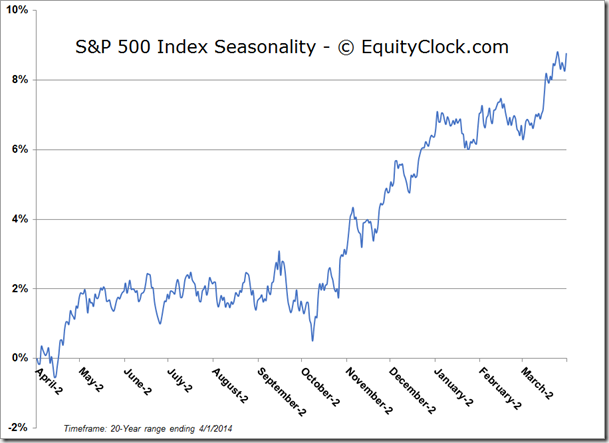
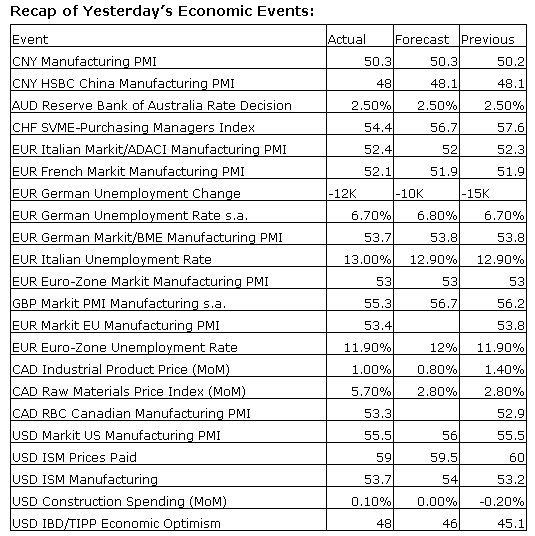
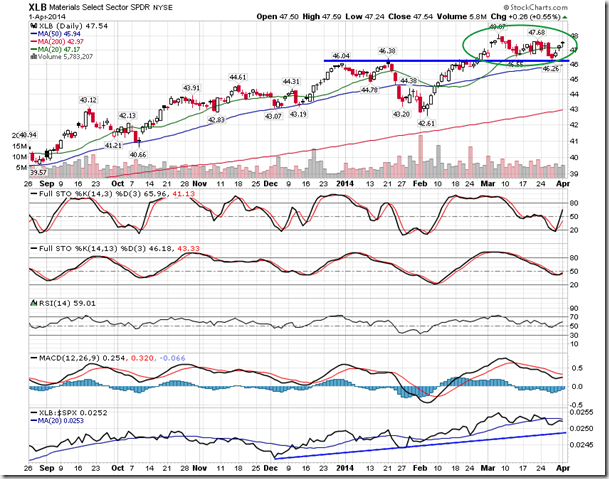
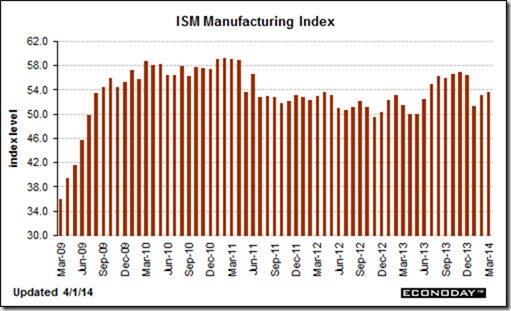
Stocks traded higher on Tuesday, benefitting from the start of month and start of quarter fund inflows that have become a common phenomena. The return for the S&P 500 Index of 0.70% was inline with the 20-year average return for April 1st of 0.76% as the benchmark attempts to realize the strong return that is typical for the month of April. Gains for the fourth month of the year, based on data from the past 20 years, have averaged 2.2%, the strongest return of any month of the year. Materials and Energy are typically the strongest sectors during the month as manufacturing demand picks up following the winter months. Tuesday’s report from the Institute of Supply Management suggests that this trend is already underway. The manufacturing index continued to climb compared to previous months, posting an expansionary 53.7, improving from the drop to 51.3 posted for the month of January as inclement weather strained economic activity. The trend in manufacturing and the related equity sectors typically peaks by the beginning of May.
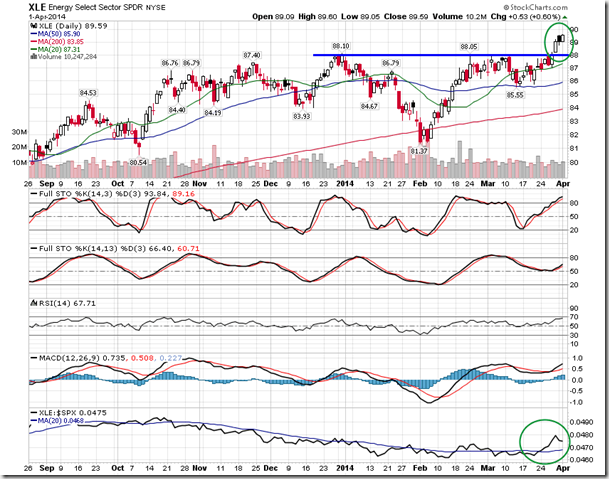
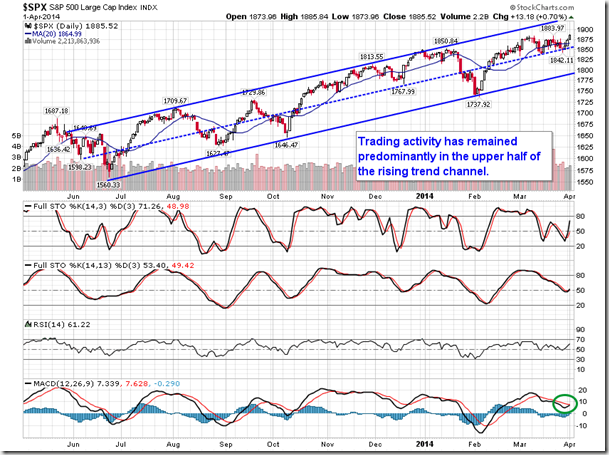
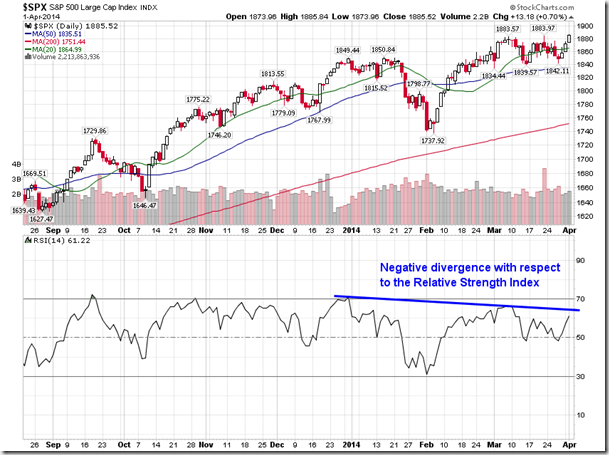
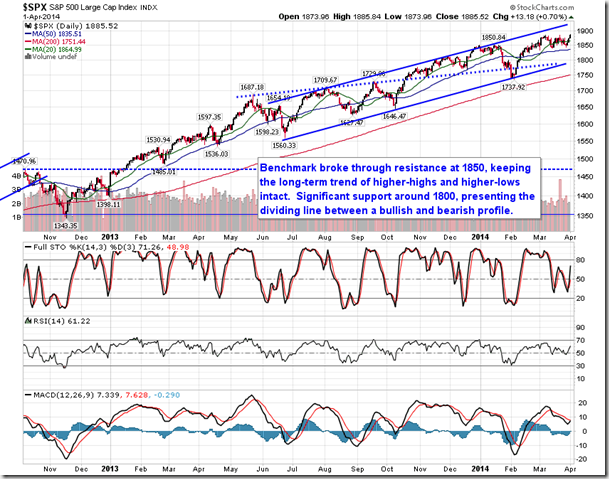
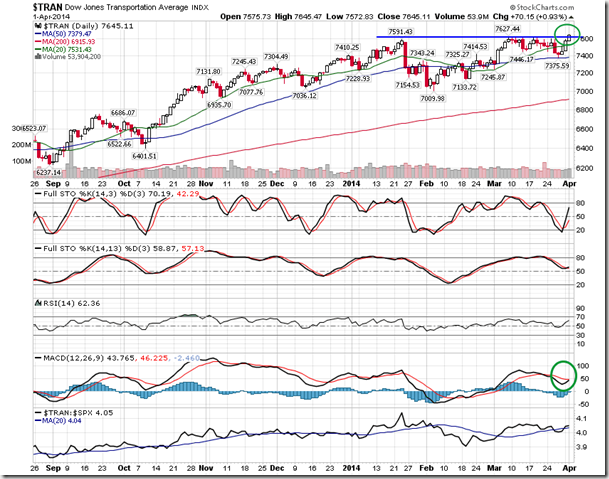
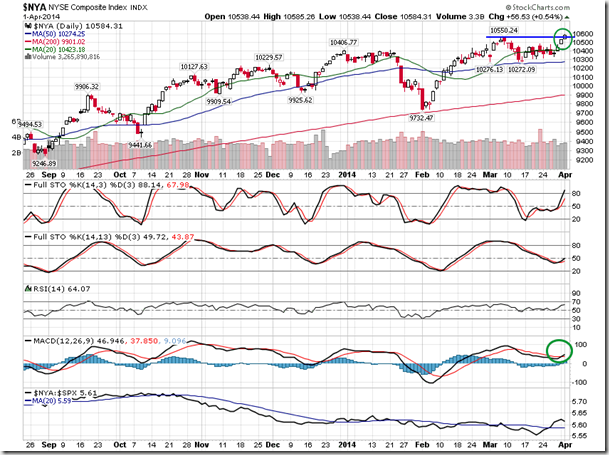
With the broad market gains recorded on Tuesday, a number of benchmarks hit new all-time highs. The S&P 500 Index, Dow Jones Transportation Average, and NYSE Composite all surpassed resistance at the previous peak charted just one month ago. Bullish MACD crossovers are becoming apparent across each benchmark as momentum shifts back to positive. The Nasdaq Composite and Russel 2000 have already been highlighted a couple times this week for the fact that they’re maintaining their long-term rising trend channels. The S&P 500 remains above the middle line of a trend channel that stretches back to the summer of this year and the relative strength index continues to hover above 50, both bullish characteristics that are supportive of higher equity prices. The trend channel for the S&P 500 peaks around 1930.
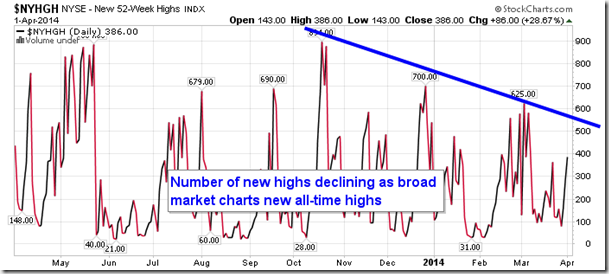
But despite the new highs amongst equity benchmarks, the number of new 52-week highs is at the lowest level of prior instances of all-time highs charted since October. And, although the Relative Strength Index for the S&P 500 index continues to hover above 50, a negative divergence is becoming apparent. The strength of the positive trend in many equity benchmarks is waning, suggesting that the conclusion to the rise in stock prices that has effectively remained uncorrected since November of 2012 is right around the corner.
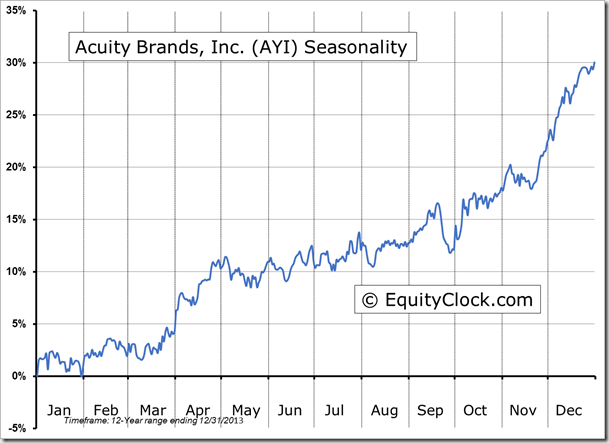
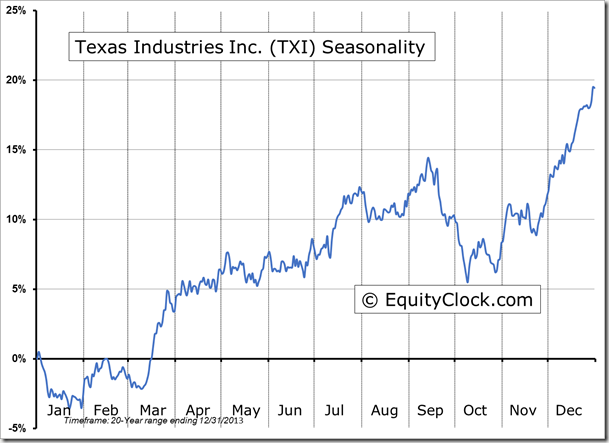
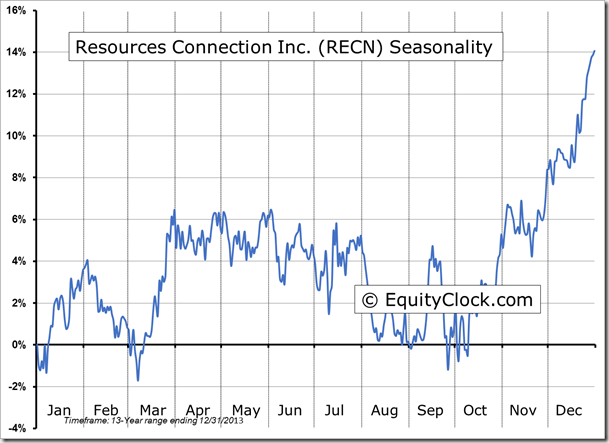
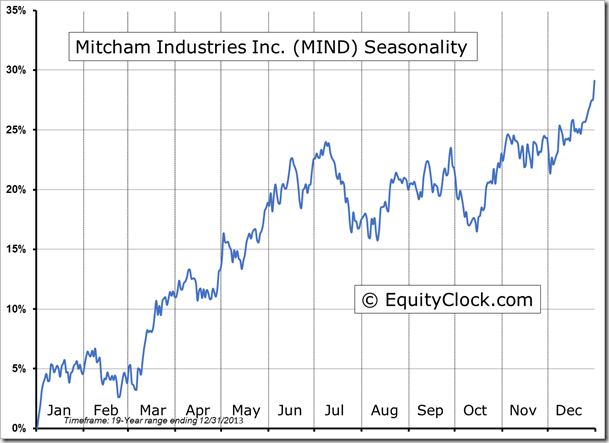
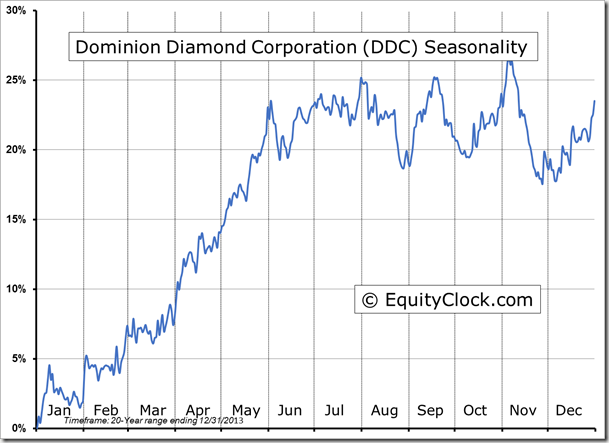
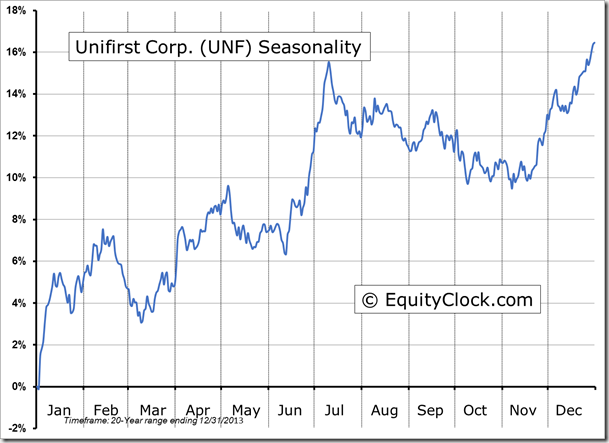
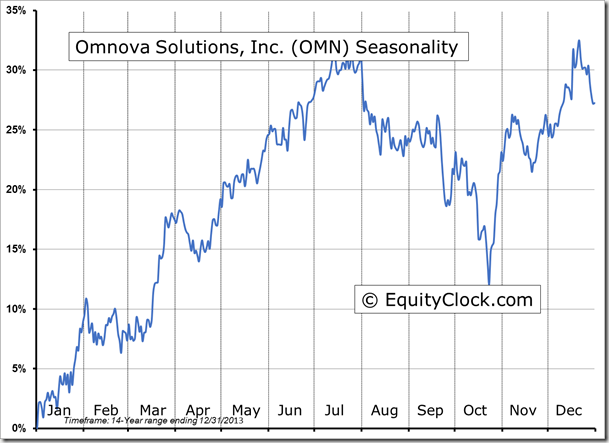
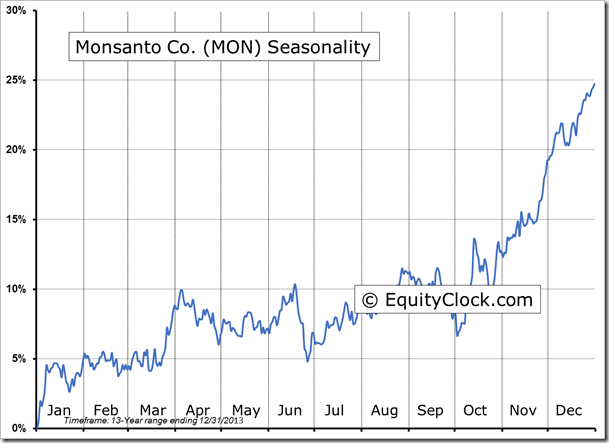
Seasonal charts of companies reporting earnings today:
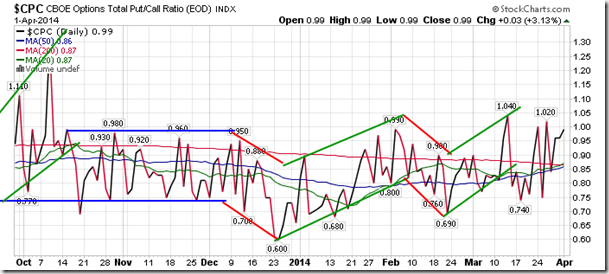
Sentiment on Tuesday, according to the put-call ratio, ended close to neutral at 0.99. Investors appear to have been using the all-time highs in equity markets and the decline in the volatility index (VIX) on Tuesday to buy protective put options, uninterested by the prospect of loading up on upside call options, which would be a typical event for a euphoric breakout day. The put-call ratio is currently at the same level that it was during the February low when investors panicked out of equity positions accumulated during the fourth quarter of last year. Optimism and confidence in the all-time equity market high is notably absent.
S&P 500 Index
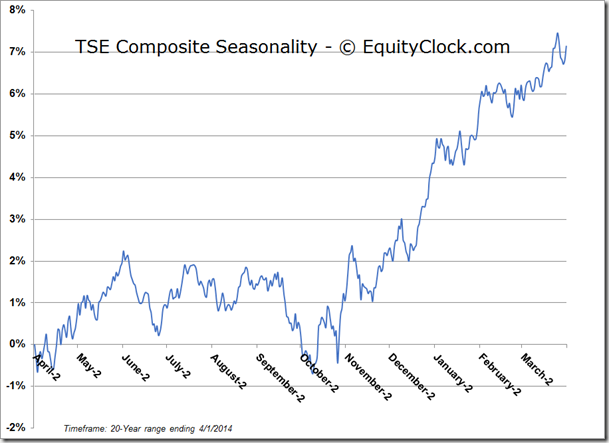
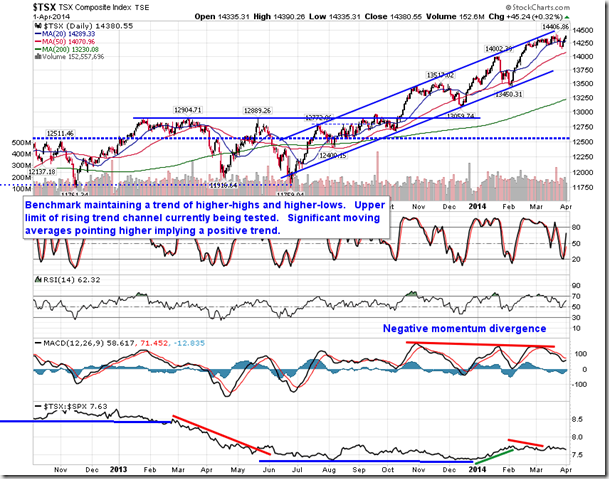
TSE Composite
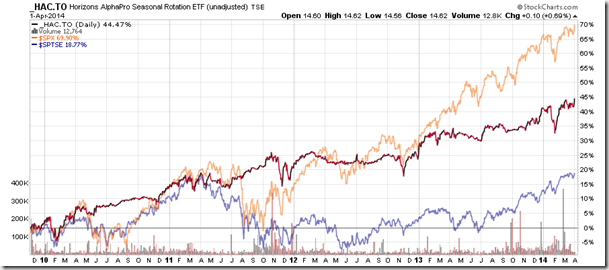
Horizons Seasonal Rotation ETF (TSX:HAC)
- Closing Market Value: $14.62 (up 0.69%)
- Closing NAV/Unit: $14.59 (up 0.54%)
Performance*
| 2014 Year-to-Date | Since Inception (Nov 19, 2009) | |
| HAC.TO | 2.03% | 45.9% |
* performance calculated on Closing NAV/Unit as provided by custodian