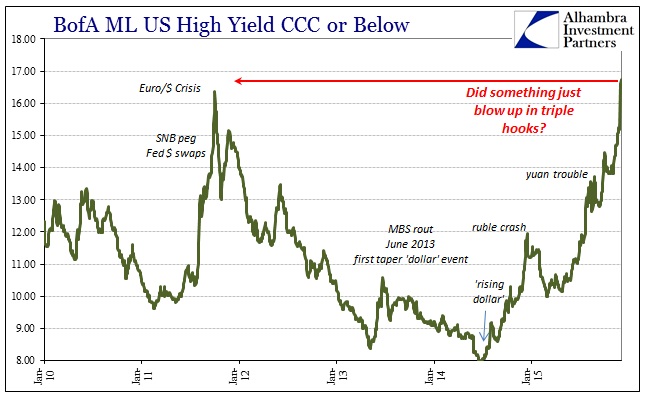
If the junk bond bubble was this week’s most visible inducement toward illiquidity, there have been more than enough indications that might corroborate and explain. With a few more days trading, the huge jump in BofAML’s CCC junk index rate has been confirmed – with another albeit smaller surge again yesterday. At now 16.74%, that is significantly above the prior “cycle” peak from early October 2011. Other junk price and yield indices still aren’t displaying any of the same desperation or urgency, but continue to be whittled down (in price) at an alarmingly steady rate.
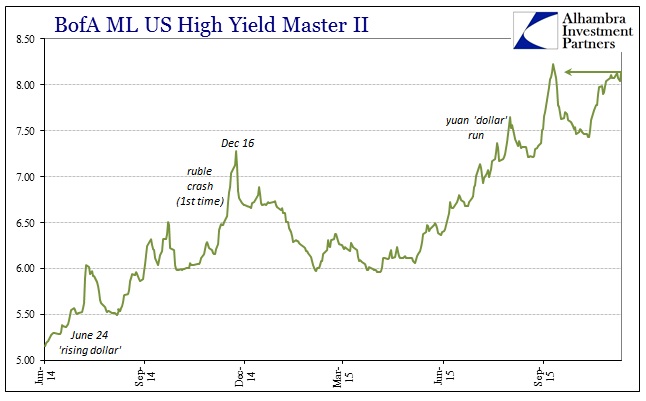
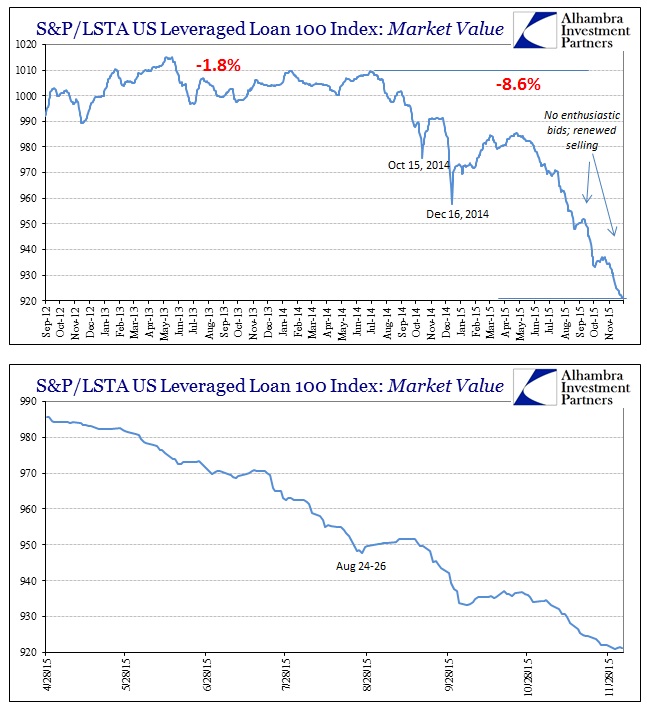
There are a few places in the “dollar” funding world that stand out as far as some kind of shift into December. First and foremost is the Swiss franc, which had devalued all the way past 1.03 at the end of last week. Starting this week, however, the franc has been hugely bid against the “dollar” tide, perhaps suggesting a huge layoff of risk based on (or part of) the ongoing events in junk (especially CCC). Whether or not that would be a dealer problem isn’t clear, but that would be the (mild) suggestion.
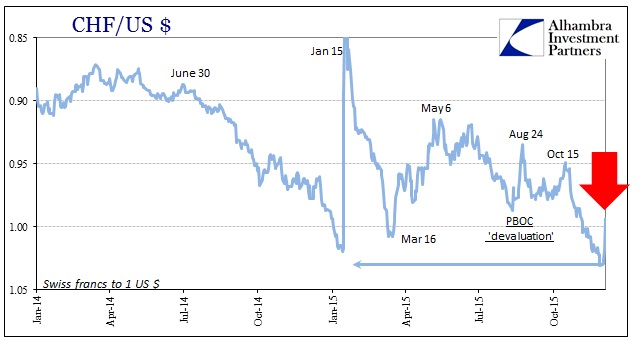
The last time the franc reversed this hard this fast, suddenly shifting from with the “dollar” run to against it, was that nearly two week period between the PBOC’s breaking its attempted CNY peg and the global liquidations that followed on August 24 and into the 25th.
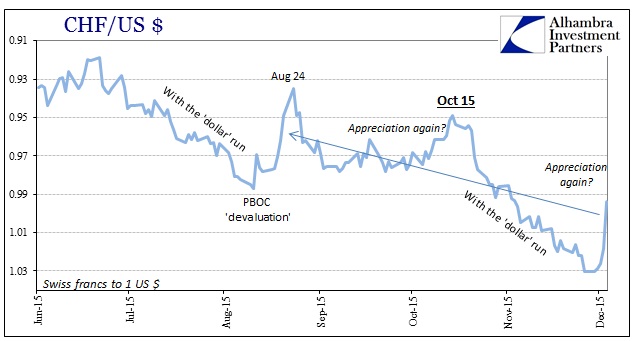
The franc being exposed like this as a potential “flight to safety” (really a “flight” to risk reductions and funding backup) makes a compelling case for interpreting the potential junk problem as more than the usual that we have come to expect in this slower-motion collapse. As in August, there are innumerable Asian clues to further color any analysis and interpretation.
That starts with an enormous spike in offshore HIBOR rates that began only two trading days before our CCC explosion. The O/N rate in HIBOR (Hong Kong yuan liquidity) went from 2.913% on Friday, November 27 to 4.823% Monday (and then topping yesterday at an undoubtedly disruptive 8.328%, the highest since the last few days in September and that “dollar” and RMB breakout that was interrupted by the Golden Week). The yield on BofAML’s CCC index was similarly affected on Monday; 15.18% in published yield last Friday, November 27 and then whatever broke Monday to push it to 16.61%, and now 16.74%.
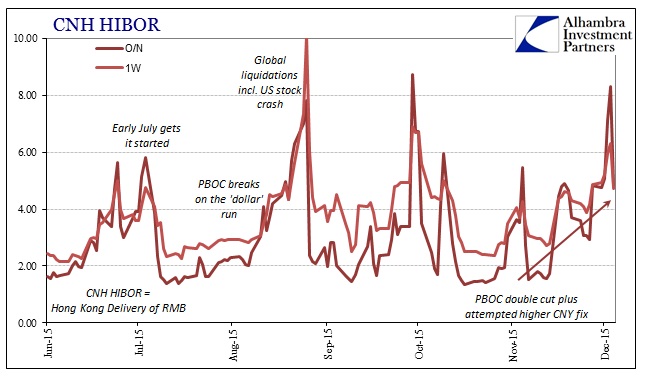
Given the interrelationships between “dollar” and both CNY and CNH, it figures that the official middle rate for the CNY/USD exchange was “allowed” now above 6.40 (6.4039 this morning compared to 6.3985 on Monday). The middle rate, or reference rate, is the fix of the middle of the trading band that the PBOC tolerates, and thus acts as its attempted control point into wholesale “dollar” funding. A higher middle rate “allows” Chinese banks to “buy” “dollars” at more expensive levels.
The “devaluing” CNY rate, then, suggests liquidity difficulty in China which is nothing but confirmed by the offshore action in CNH. In short, nothing much has changed since August except the starting and (potential) endpoints for all these interconnected “dollar” features.
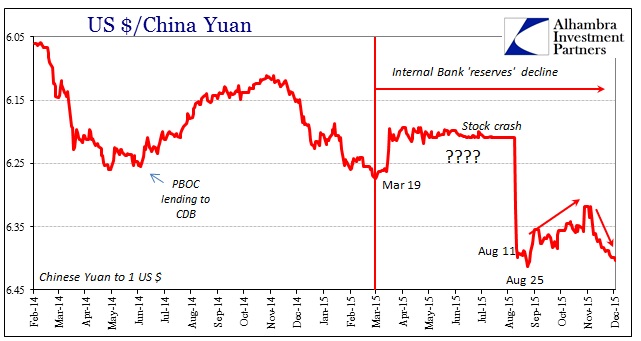
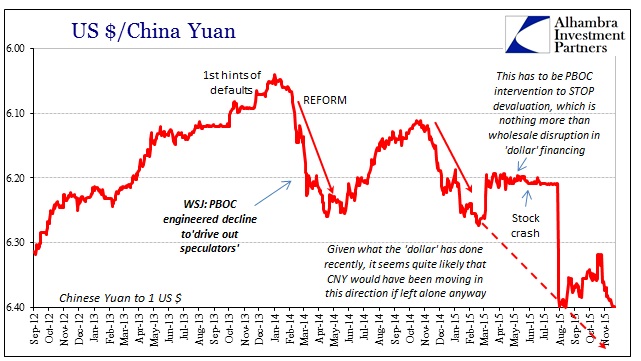
What isn’t as clear is the proximate cause for this revisiting, corporate junk bubble and all. Is this monetary policy as the “market” gains more acceptance of what Janet Yellen claims will happen in about two weeks? It certainly cannot be ruled out and I wouldn’t doubt if that were a part of the unwinding here. However, I still think it more of an intensification effect of the underlying, namely the recovery that is no more.
This doesn’t just answer why swap spreads would be so negative of late, and so widespread in that condition, it answers a great deal about the “sudden” accumulation of “recessions” spreading across the domestic and global economy. The incidence of “deflation” pressures and worries all over the world are likewise consistent with this agitated, not “strong”, dollar. It is quite simply a “money supply” issue only one that doesn’t contain what is conventionally assumed of money. Banks, the true nature of wholesale money, are leaving the business and lately they can’t do so fast enough. Central banks cannot pick up the slack because they first don’t believe in it, starting backwards as they do not just about the recovery but also what money is to them, and second are incapable. They cannot supply what is in shortage; wholesale “dollars” particularly in the dark leverage components of FICC that sustain the eurodollar’s steadier states.
It has come to this because these same banks, at various points in the recent past, had the great burden of trying to wager on the recovery and economy that traditional, now anachronistic, economics forecasts from its simplified math and ancient operative abilities. In a credit-based reserve currency regime you cannot expect economic expansion where no institution wants to be that credit base.
The “this” at the start of that passage was the repeated pattern of banks betting on recovery only to get burned for their trouble. The most infamous of those attempts occurred at the outset of what is turning out to be the peak of the eurodollar recovery around the middle of 2011 – JP Morgan’s London Whale that seemingly “welcomed” the 2012 slowdown. The relevant point about IG9 and getting pinned so spectacularly to a single trade to the tune of a $7.5 billion loss is why it all started in the first place:
In late 2011, CIO considered making significant changes to the Synthetic Credit Portfolio. In particular, it focused on both reducing the Synthetic Credit Portfolio, and as explained afterwards by CIO, moving it to a more credit-neutral position. There were two principal reasons for this. First, senior Firm management had directed that CIO – along with the lines of business – reduce its use of RWA. Second, both senior Firm management and CIO management were becoming more optimistic about the general direction of the global economy, and CIO management believed that macro credit protection was therefore less necessary. [emphasis added]
That is JP Morgan’s own description of the affair from its internal report. The London Whale was really nothing more than the clumsy and ill-conceived effort to turn the bank’s synthetic credit portfolio from short in terms of general risk to long the recovery because they thought central banks got it right. Specific episodes at the various eurodollar banks in the years since don’t make such great stories and headlines, but the premise and result have undoubtedly been repeated far too many times. That would include, as we have been reminded yet again this week, the often dramatic reversal of the junk bond bubble that several banks had intentionally joined as late as the middle of last year.
The frontline of “dollars” in Asia appears to be the contours of that baseline – if risk and thus wholesale dark leverage is being unwound, and there is no doubt that they are, it makes only good sense to do so at the furthest (riskiest) edges first. That would mean getting out of China since the end of recovery here isn’t going to lead to anything but greater trouble there, the exact same as junk bonds and, of course, money dealing in either. The tide simply recedes first where it stretched inland the farthest.
