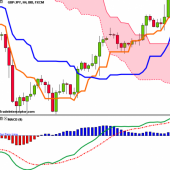
The Currency Score analysis is one of the parameters used for the Ranking and Rating list, which was published earlier. This article will provide my analysis on the 8 major currencies based on the technical analysis charts, using the MACD and Ichimoku indicator on 3 time frames: the monthly, weekly and daily. The results of the technical analysis are the 2 screenshots in this article showing the Currency Score and the Currency Score Difference.
Last 12 months currency classification
The last 12 months currency classification from a longer term perspective are provided for reference purposes. See, for more information, the article: June Monthly Currency Score, where the charts are available. There are no changes since June, and the currencies are classified for the coming months as follows:
- Strong: CHF / GBP / USD. The preferred range is from 6 to 8.
- Average: NZD /CAD. The preferred range is from 4 to 5.
- Weak: AUD / JPY / EUR. The preferred range is from 1 to 3.
Currency Score
For analyzing, the best pairs to trade this classification is the first issue. When looking at the most recent score that is used for the coming period, we can see in the screenshot below the following deviations:
- The NZD has a score of 1. This is an average currency and it should have by preference a score from 4 to 5. It has a score at the moment of a weak currency.
- The EUR has a score of 5. This is a weak currency and it should have by preference a score from 1 or 3. It has a score at the moment of an average currency.
The conclusion is:
- Most currencies are at the right level when looking at the last 3 months currency classification. Only the NZD and the EUR are not at the right level.
- There is a pullback at the moment for the NZD when looking at the market as a whole.
- There is a pullback for the EUR when looking at the market as a whole.
- The pairs that we may look at are all most probably trending, except for the pairs with the NZD and EUR, which are most probably ranging.

Currency Score difference
According to the Ranking and Rating list already published this month, the following pair combinations look interesting.
When looking at the Currency Score Table here below for this month, we can see the currency score differences. The interesting pairs should have by preference a score difference of 4 or higher when they are similarly classified. Or, the better classified pair should have a higher score than the counterpart. All the pairs mentioned above comply for trading in the coming month. The currencies are colored green, orange and red resp. by the classification they have. This way, it is easier to see what currencies should have a certain score difference.

The technical analysis is the most important issue to consider before taking positions. The Monthly Chart is being analyzed. I prefer the Bollinger Band® for defining where a pair is in the chart. Once a pair is outside a Bollinger Band, it is in a strong trend, which can cause a strong pullback. Although this may be a good opportunity for other analysts, I avoid taking positions because of the possible unexpected strong pullback. Positions are only opened inside the Bollinger Band, and this may be at the start of a possible trend or on a good pullback in an existing trend.
- The GBP/NZD is in an uptrend and outside the Bollinger Band. It seems best to wait for a pullback to see the pair back again within the Bollinger Band.
- The NZD/CHF is in a downtrend and outside the Bollinger Band. It seems best to wait for a pullback to see the pair back again within the Bollinger Band.
- The GBP/AUD is in an uptrend and outside the Bollinger Band. It seems best to wait for a pullback to see the pair back again within the Bollinger Band.
- The CHF/JPY is in an uptrend and at the Bollinger Band.
- The AUD/CHF is in a downtrend and within the Bollinger Band.
- The GBP/JPY is in an uptrend and at the Bollinger Band.
The Monthly Currency Score and Currency Score Difference are still in the evaluation phase. The review on the strategy will not be published for the time being because of further testing of the system. You can follow the Weekly strategy to stay informed on the progress and development of the strategy.
If you would like to use this article, then mention the source by providing the URL FxTaTrader.com or the direct link to this article. Good luck in the coming month and don't forget to check my weekly Forex "Strategy Review" and the "Currency Score."
DISCLAIMER: The articles are my personal opinion, not recommendations. FX trading is risky and not suitable for everyone.The content is for educational purposes only and is aimed solely for the use by ‘experienced’ traders in the FOREX market, as the contents are intended to be understood by professional users who are fully aware of the inherent risks in forex trading. The content is for 'Forex Trading Journal' purpose only. Nothing should be construed as recommendation to purchase any financial instruments.