Uptrend & Corrections
Health Care Select Sector SPDR (N:XLV) has been one of the strongest sectors since 2012; it pretty much went vertical since the late-2011, and it ran for three straight years before seeing a correction earlier this year.
Technical speaking, early-2009, mid-2010, and early-2012 were the best time to go long for the long-term trade strategy (1-3 years) and adding on any sizable dips.
This strategy would've yielded very nice gain by the late-2014 or early 2015. However, it would've been difficult to start a new completely-fresh long-term position after it took off in 2012, because of the fear that we may see a correction up ahead.
But this market knows the thinking of the majority, and XLV did not see any sizable corrections until the early this year (because since 2009, it seemed like a clockwork to get a corrections in every year and half).
- So, this is one of those times just like 2009, 2010, 2012; the potential level to start preparing to engage in a new position for the long-term trade strategy (1-3 years)
What most traders fail to see when the "fear" grips in into the market, is the "opportunity". There are always going to be contradicting data when you are seeking to find bullish signals after correctional move.
So first, trader must come to a conclusion that the overall market has been fully reversed before his/her hunt begins for a trade setup, because, generally speaking, majority of the stocks will follow the direction of the overall market indices.
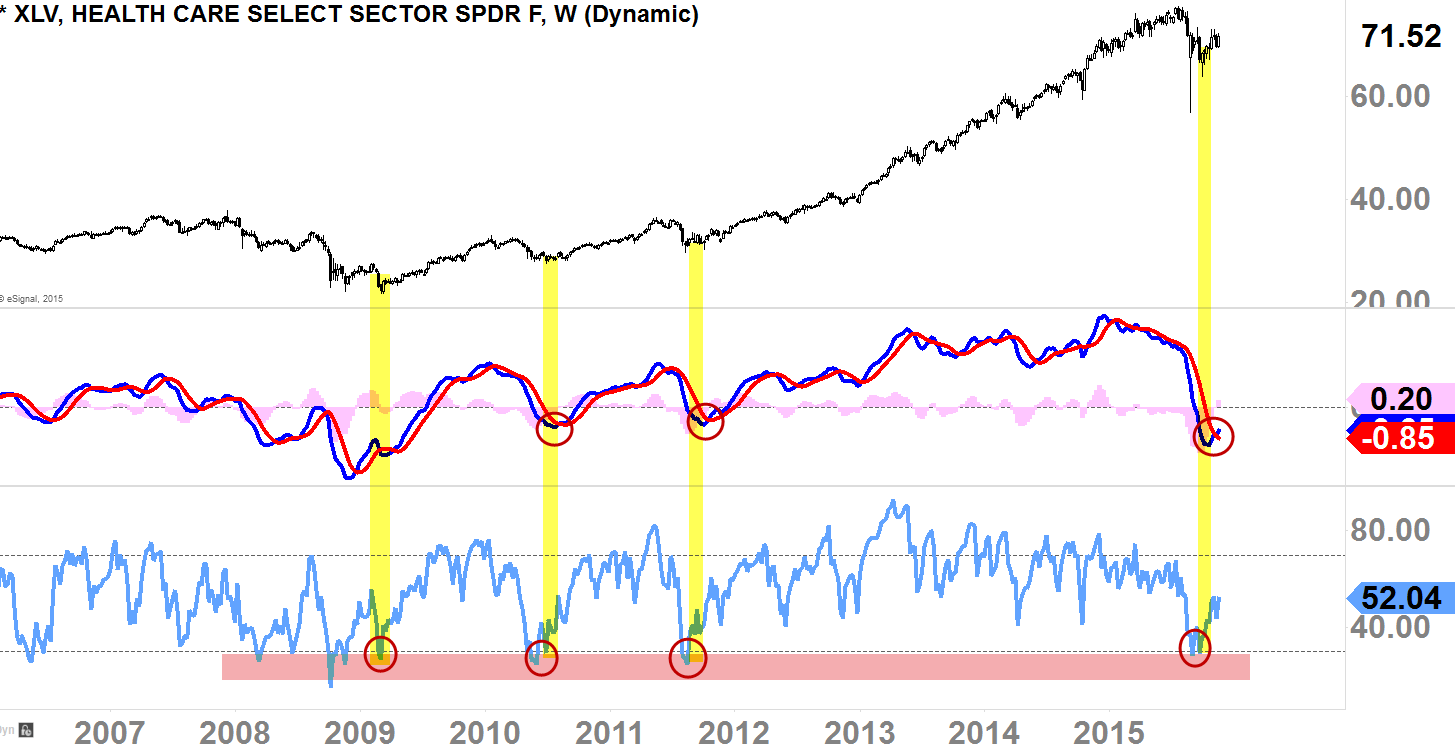
- Looking at the weekly-chart below, we can see that MACD "bullish cross" is in the picture while the RSI has already bounced off of the "oversold" level
This is important because the weekly-RSI has only gone to this "oversold" level three times since 2009, so definitely a level to keep an eye on it for sure.
MACD's "bullish cross" is also very important because this is the first time we are seeing weekly-MACD showing positive signal ("bullish cross") since the correction occurred just several months back. 
Dip Buyers
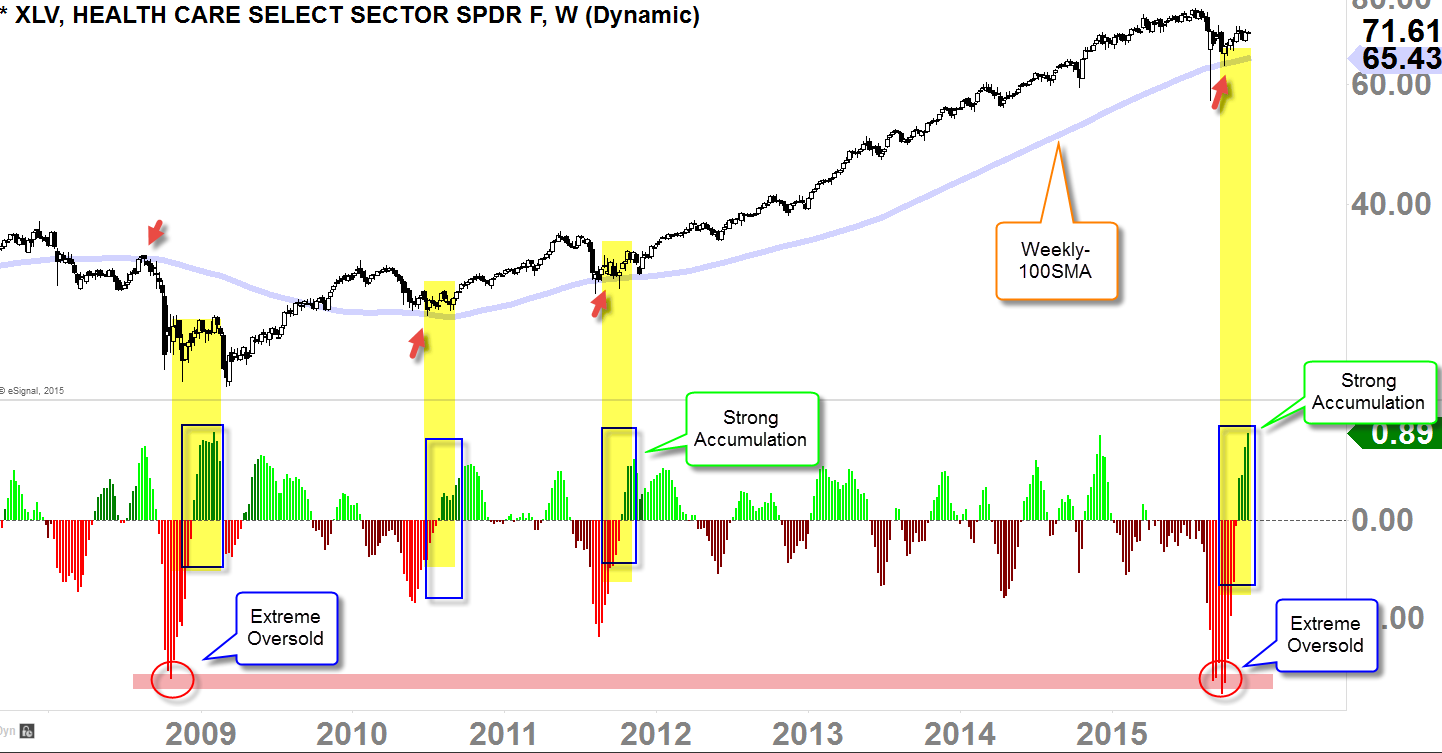
First, take a look at the weekly-100SMA as it has been acting as strong pivot (resistance and support) since late-2008 (see arrows); it's like clockwork!
This is very valuable signal for the technical analysts because it is conveying that XLV is precisely respecting the technical levels.
The indicator you see below the price-chart is our proprietary histogram indicator; it measures major tops and bottoms with gauging the accumulation and distribution levels. It works well when you are trying to determine the bounce after a corrections like you've seen earlier this year.
The biggest question is, are we done selling, and ready to go back up.
What we see in this indicator is, that we do have "strong accumulation" today which is very similar to what we saw in 2009 after the crash. It's also important to note, that we did hit "extreme oversold" level before it spiking back up (which is also very similar to 2009), which, that iterates there are many 'dip buyers' in this vicinity knowing that this might be a good opportunity for the long-term trade strategy.
- This signal suggests that we have high probability of correction being over, and the primary-term uptrend is ready to resume
Trade Setup
So as we looked at few charts of the long-term sentiment of the Health Care sector (XLV) in this post concluding that we have high probability of the primary-term uptrend resuming back up,
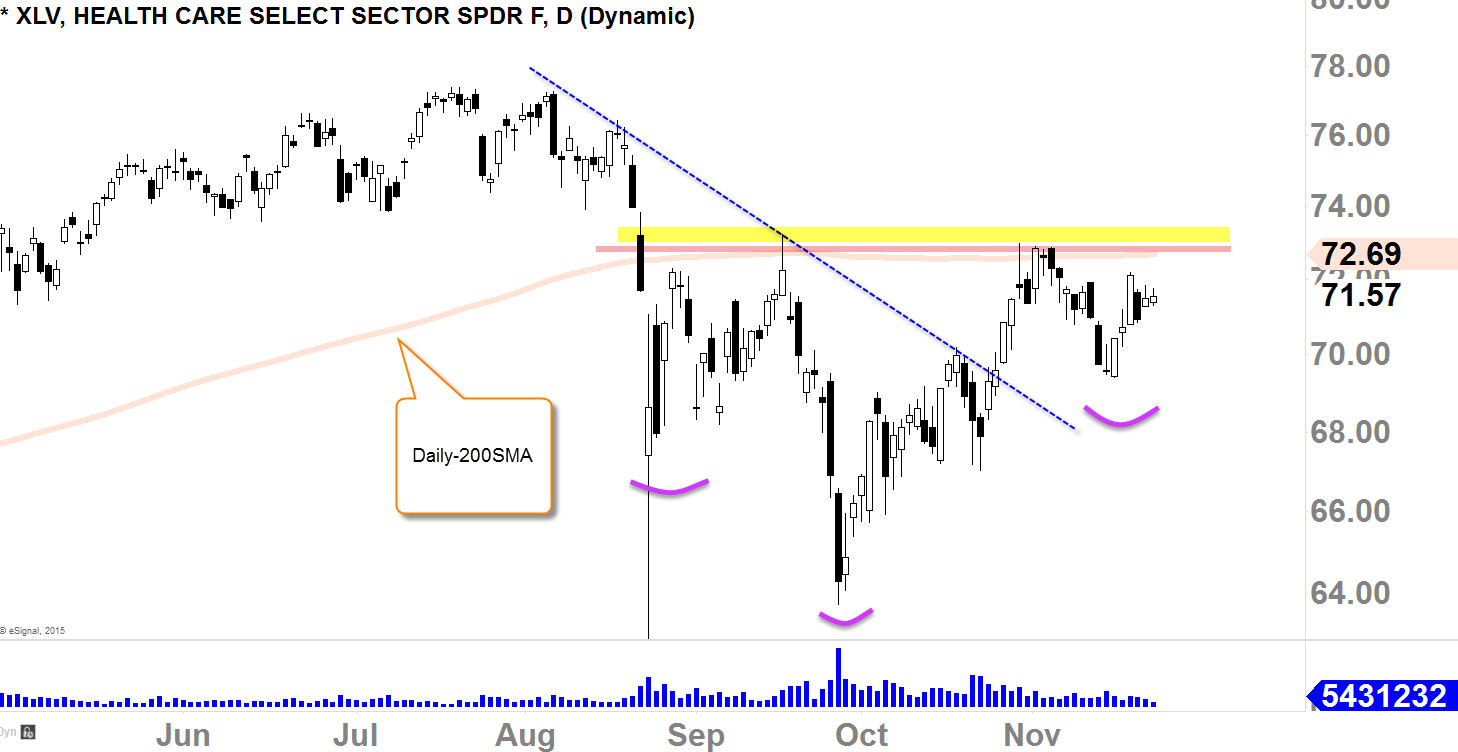
let's zoom in (to a daily chart) and ascertain the level of an entry.
- There are few things to consider
- Recent downtrend resistance has been broken (falling blue dotted line)
- Daily-200SMA is acting as strong resistance at around $72-$73 (horizontal pink)
- Inverted H&S Bullish Reversal pattern (purple) has been formed, but NOT confirmed as of today
So here is the setup
First, we would need the price-action to stay well-above the $73.00-$73.50 level so we can be sure that the daily-200SMA resistance has been broken (or reclaimed to the upside).
Once this $73-$73.50 price-level has been reclaimed, we also want to make sure that there are no 'head-fakes' or 'traps'; so we would need the price-action to stay above this level ($73-$73.50) for 2-3 days to ensure of this.
Once we can confirm these steps, we can then categorize this Inverted H&S Bullish Reversal pattern as "confirmed." and at that time it would be a good time for an entry.
- I would not enter this trade until all of the steps I have proposed are met


